Fig. 14.
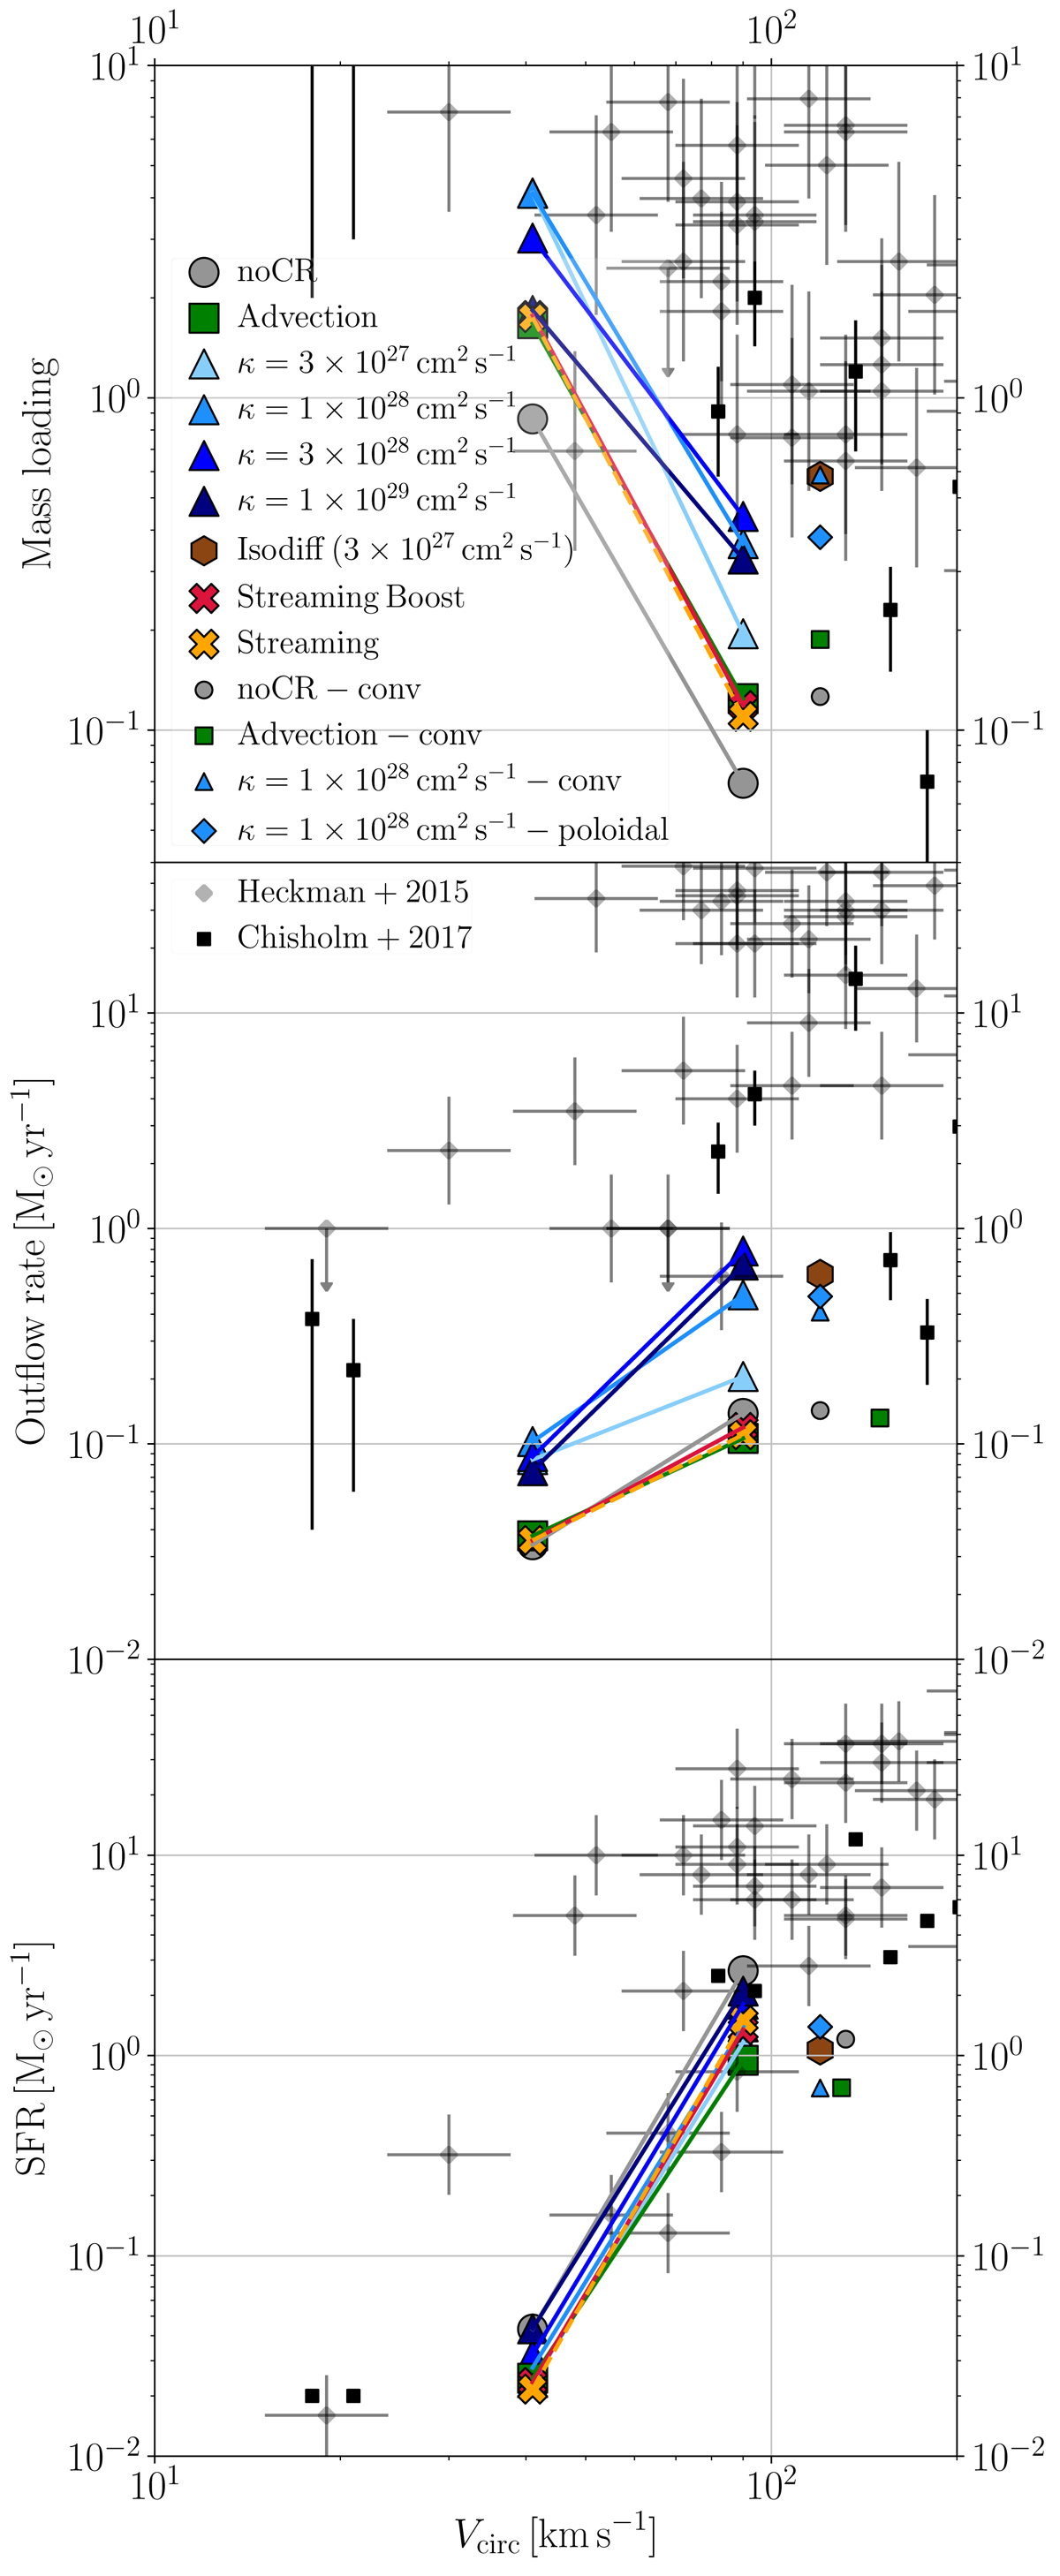
Markers show the time averaged (between 75 – 250 Myr) outflow rates (top) mass loading factors (middle) and SFR (bottom) as a function of the circular keplerian velocity of G8 (41 km s−1) and G9 (90 km s−1) at the galactic scale radii. For G9, some of the markers are shifted for clarity. The data points are taken from Heckman et al. (2015) and Chisholm et al. (2017). The labels with the suffix “-conv” are convergence study runs and are discussed in Sect. 5. The poloidal (blue diamond) run is discussed in Sect. 6.
Current usage metrics show cumulative count of Article Views (full-text article views including HTML views, PDF and ePub downloads, according to the available data) and Abstracts Views on Vision4Press platform.
Data correspond to usage on the plateform after 2015. The current usage metrics is available 48-96 hours after online publication and is updated daily on week days.
Initial download of the metrics may take a while.