Fig. 2
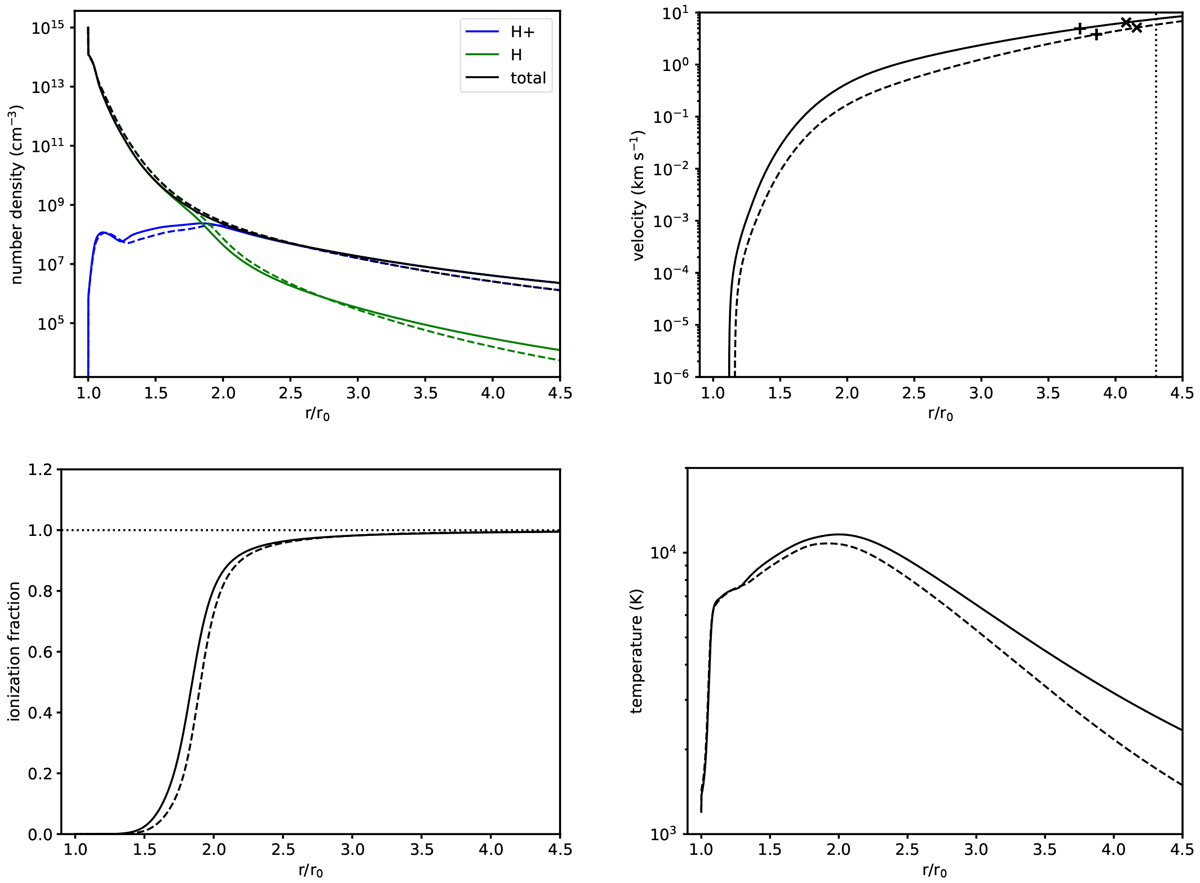
Planetary atmospheric profiles adopting the XUV spectra of SF11 (solid) and L14 (dashed). Shown are the number densities (total, atomic H, and protons), outflow velocity, ionization fraction, and temperature. In the velocity plot, crosses indicate the sonic points and plus signs denote the locations where the outflow velocity exceeds the escape velocity. The vertical dotted line indicates the location of the L1 point.
Current usage metrics show cumulative count of Article Views (full-text article views including HTML views, PDF and ePub downloads, according to the available data) and Abstracts Views on Vision4Press platform.
Data correspond to usage on the plateform after 2015. The current usage metrics is available 48-96 hours after online publication and is updated daily on week days.
Initial download of the metrics may take a while.