Fig. 14
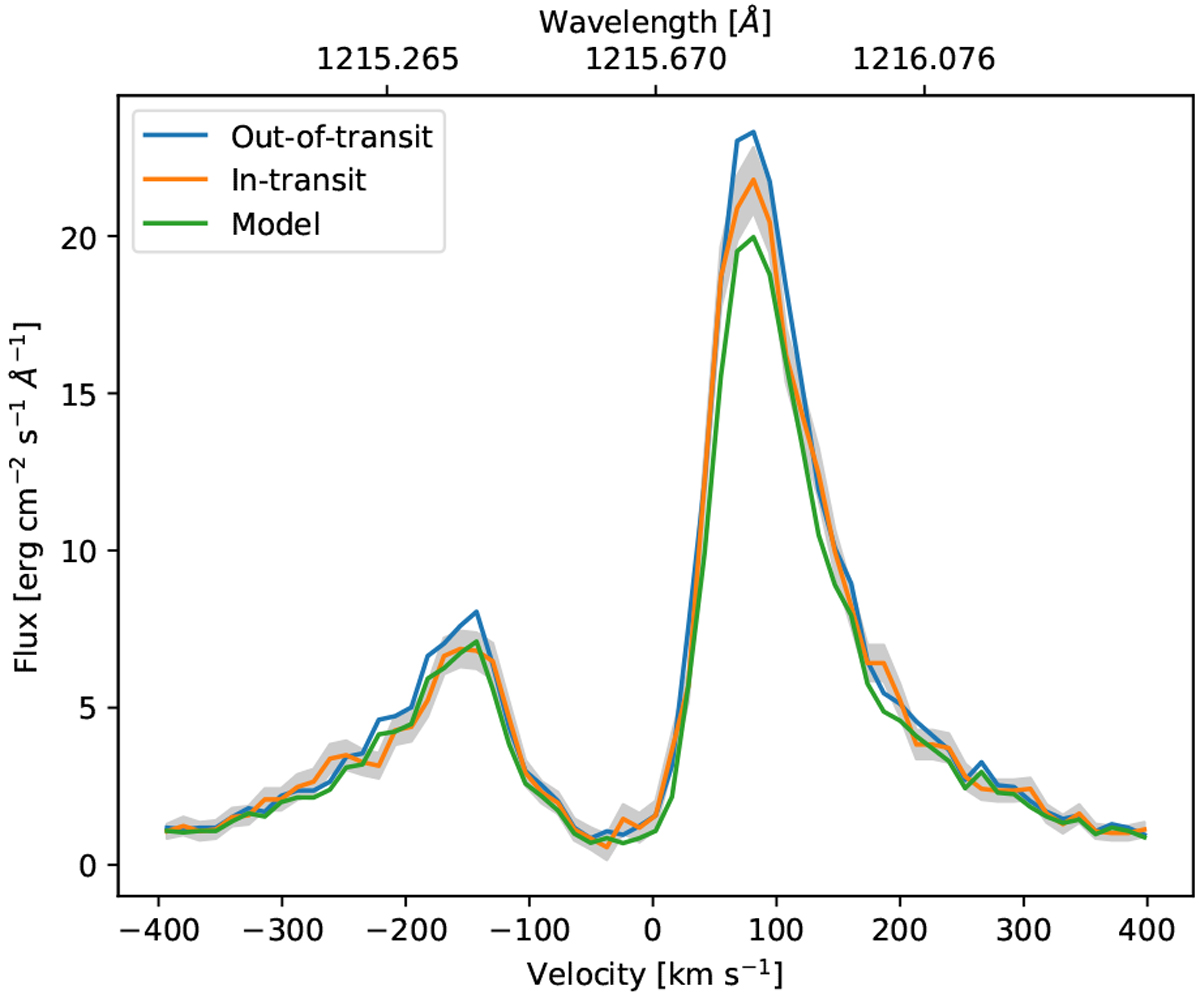
Modeled absorption of HD 189733b compared to observations from 2011 (Lecavelier des Etangs et al. 2012). The blue line shows the observed out-of-transit Lyα line profile of HD 189733. The green line shows the modeled in-transit absorption. The orange line shows the in-transit absorption observed in September 2011. The shaded region surrounding the orange line shows the observational errors. Our modeled spectrum reproduces the observed profile well (also in its red part) and is mostly within the error boundaries. Mean wind conditions were adopted, but the other cases produce identical results. The region between − 40 and + 40 km s−1 was affectedby geocoronal emission in 2011 and should be ignored (Bourrier & Lecavelier des Etangs 2013).
Current usage metrics show cumulative count of Article Views (full-text article views including HTML views, PDF and ePub downloads, according to the available data) and Abstracts Views on Vision4Press platform.
Data correspond to usage on the plateform after 2015. The current usage metrics is available 48-96 hours after online publication and is updated daily on week days.
Initial download of the metrics may take a while.