Fig. 1.
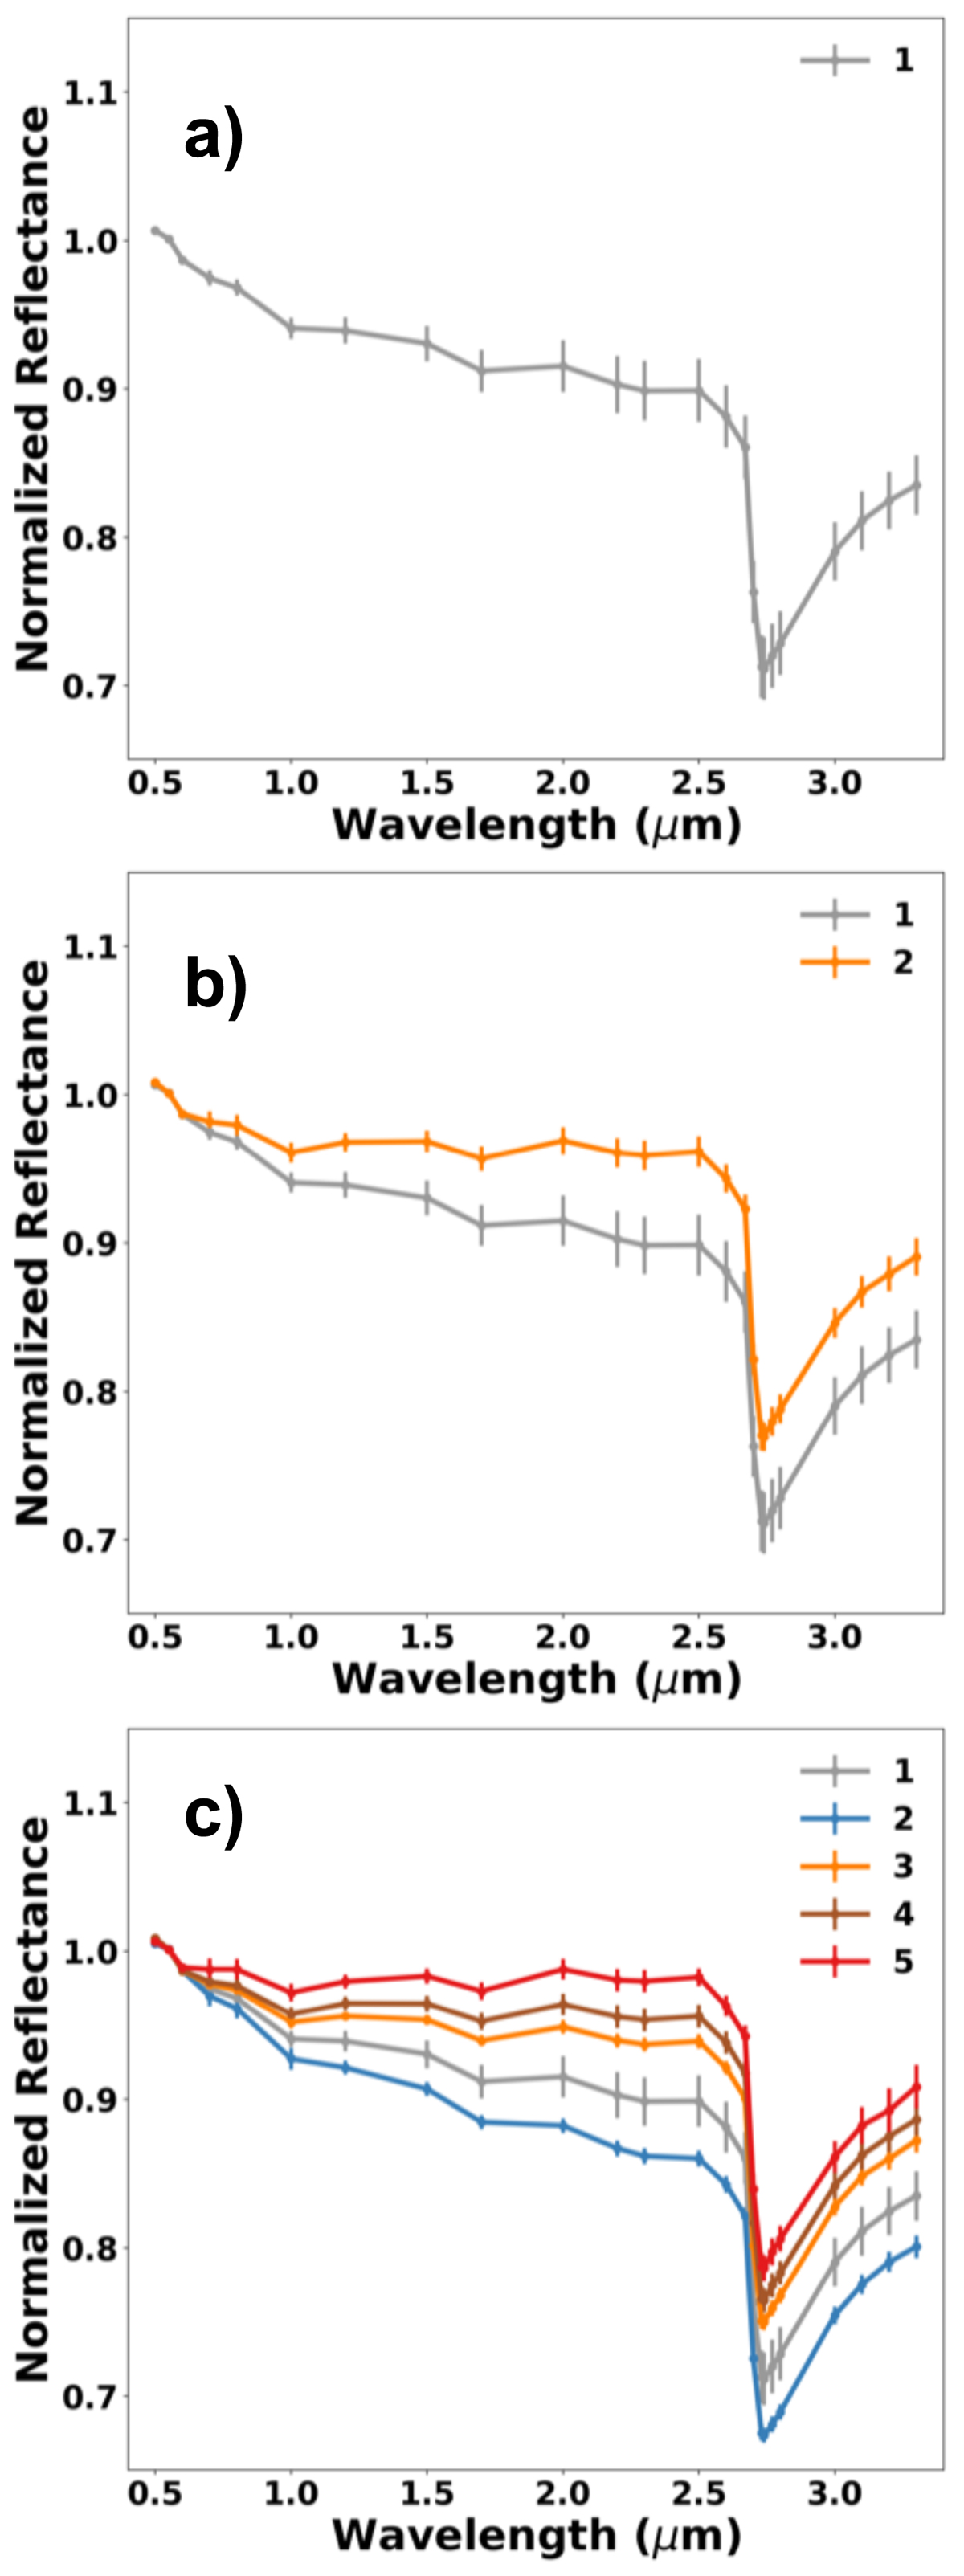
Average value of variables (normalized reflectance at 0.55 μm of the selected wavelengths) in groups identified from the OVIRS global data analysis: (a) average spectrum of the only groups obtained at a 3σ confidence level, (b) average spectra of the two groups distinguishable at a 2.7σ confidence level, and (c) average spectra of the five groups that can be distinguished at a 2.0σ confidence level. The error bar corresponds to the standard deviation of the distribution of the spectra in each group and at each wavelength.
Current usage metrics show cumulative count of Article Views (full-text article views including HTML views, PDF and ePub downloads, according to the available data) and Abstracts Views on Vision4Press platform.
Data correspond to usage on the plateform after 2015. The current usage metrics is available 48-96 hours after online publication and is updated daily on week days.
Initial download of the metrics may take a while.