Fig. 1.
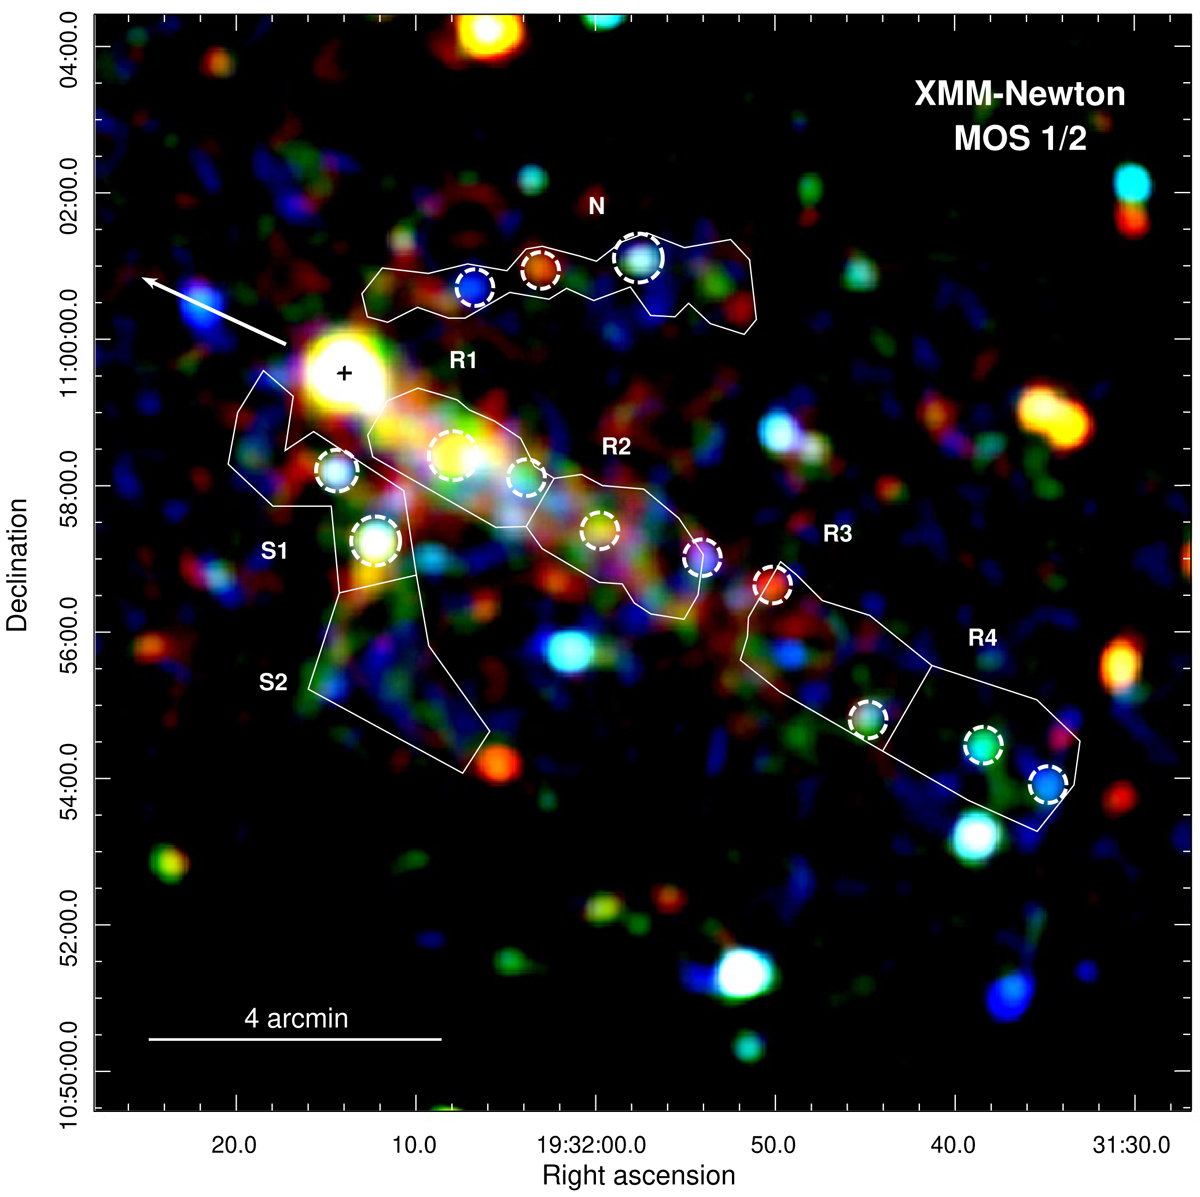
Color-coded MOS1/2 image of the field around PSR B1929+10 with merged vignetting-corrected and background-subtracted data. The pulsar position and its proper motion are illustrated by a cross and an arrow, respectively. The adopted regions for spatially-resolved analysis, R1, R2, R3, R4, S1, S2, and N, are labeled accordingly.
Current usage metrics show cumulative count of Article Views (full-text article views including HTML views, PDF and ePub downloads, according to the available data) and Abstracts Views on Vision4Press platform.
Data correspond to usage on the plateform after 2015. The current usage metrics is available 48-96 hours after online publication and is updated daily on week days.
Initial download of the metrics may take a while.