Free Access
Fig. 14.
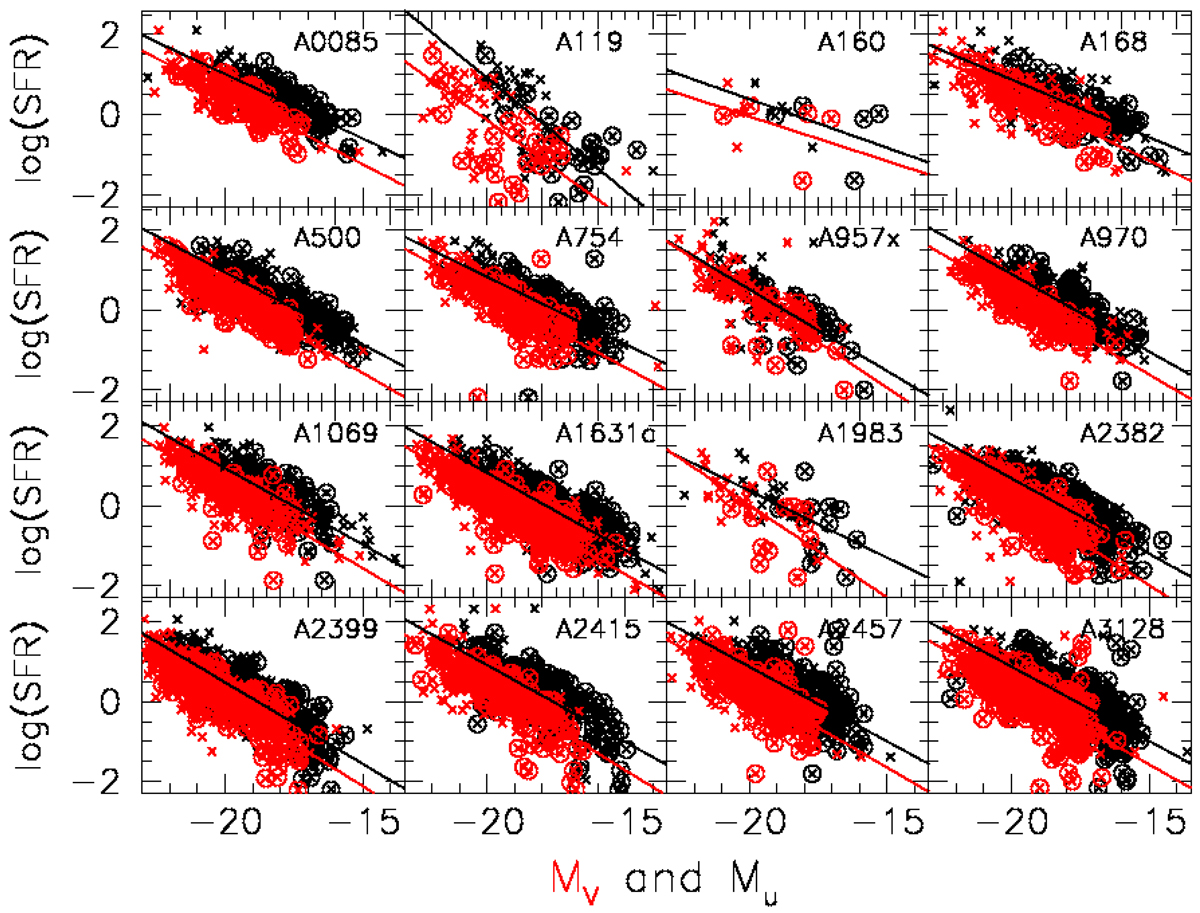
SFR vs. the absolute magnitude of galaxies in the field of our clusters. The black cross dots mark the u-band data, while the red cross dots the V-band data. The circles surrounding the cross dots mark the galaxies that are member of the clusters according to their redshift.
Current usage metrics show cumulative count of Article Views (full-text article views including HTML views, PDF and ePub downloads, according to the available data) and Abstracts Views on Vision4Press platform.
Data correspond to usage on the plateform after 2015. The current usage metrics is available 48-96 hours after online publication and is updated daily on week days.
Initial download of the metrics may take a while.