Fig. 3.
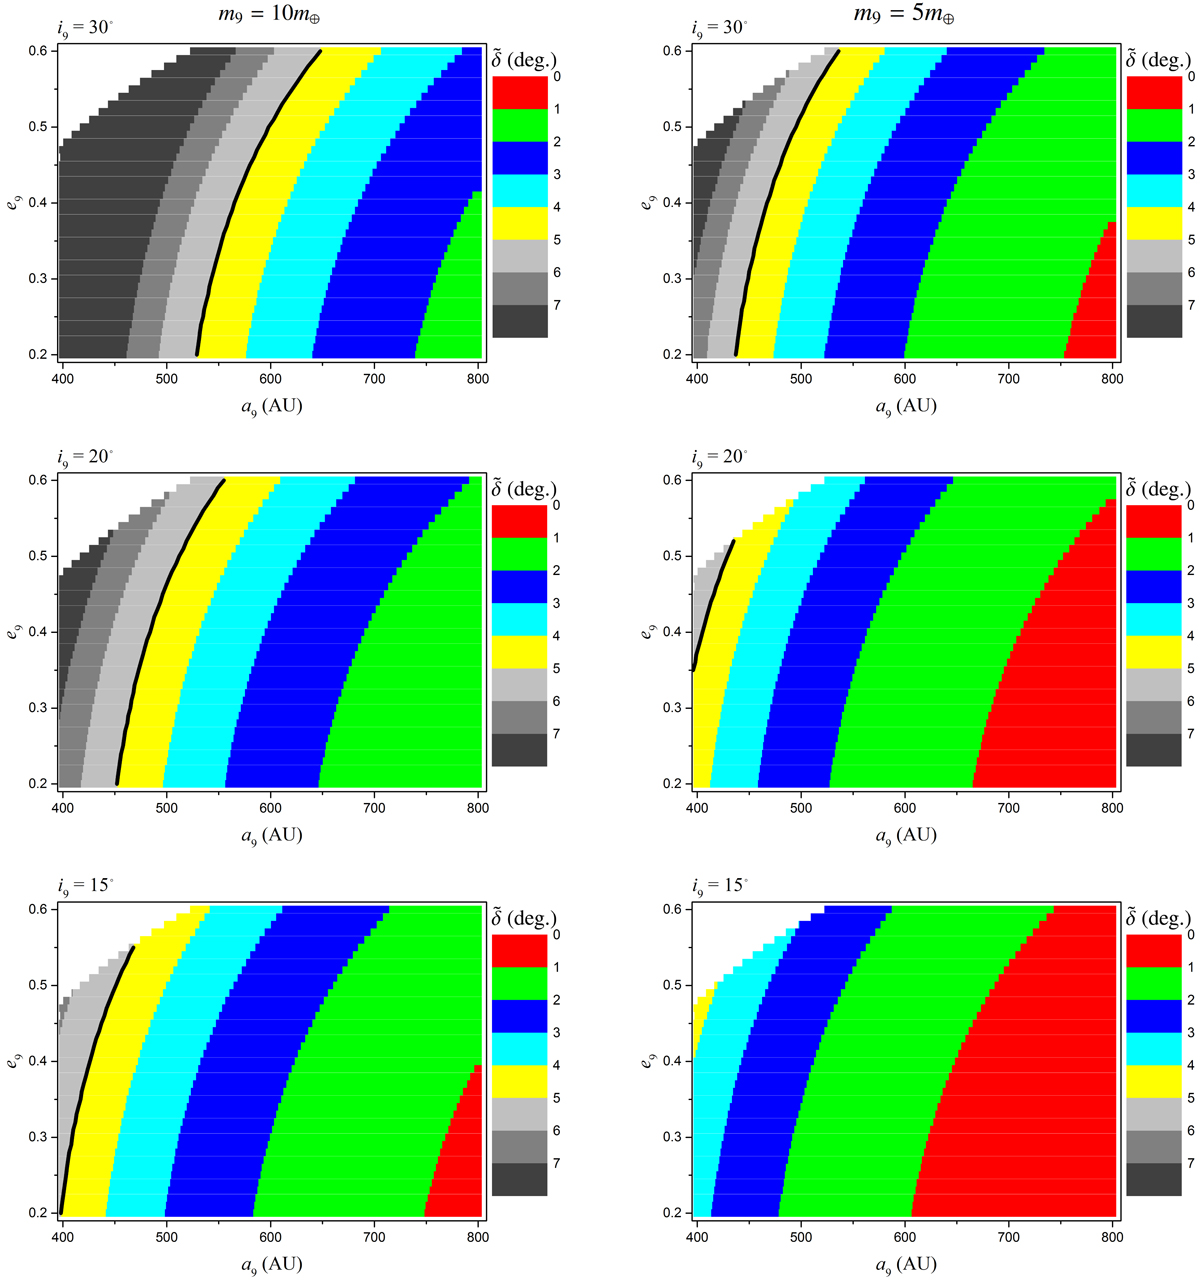
Allowable (a9, e9) space for Planet 9 with m9 = 10 m⊕ (left-hand column) and 5 m⊕ (right-hand column), at representative inclinations i9 = 15°, 20° and 30°. The color represents the relative angle ![]() between the expected mean plane of the 100 < a < 200 AU Kuiper belt and IP8. The black curve demarcates the upper limit of
between the expected mean plane of the 100 < a < 200 AU Kuiper belt and IP8. The black curve demarcates the upper limit of ![]() deduced from the known KBOs: on the right side, the colorful regions with
deduced from the known KBOs: on the right side, the colorful regions with ![]() are the most probable zones for Planet 9; while on the left side, the gray regions with
are the most probable zones for Planet 9; while on the left side, the gray regions with ![]() are less likely since the perturbation from Planet 9 seems too strong. The white regions indicate the zones with q9 − a < 10 AU, where our theoretical approach for calculating
are less likely since the perturbation from Planet 9 seems too strong. The white regions indicate the zones with q9 − a < 10 AU, where our theoretical approach for calculating ![]() may fail due to strong interactions between the KBOs and Planet 9.
may fail due to strong interactions between the KBOs and Planet 9.
Current usage metrics show cumulative count of Article Views (full-text article views including HTML views, PDF and ePub downloads, according to the available data) and Abstracts Views on Vision4Press platform.
Data correspond to usage on the plateform after 2015. The current usage metrics is available 48-96 hours after online publication and is updated daily on week days.
Initial download of the metrics may take a while.