Fig. 7.
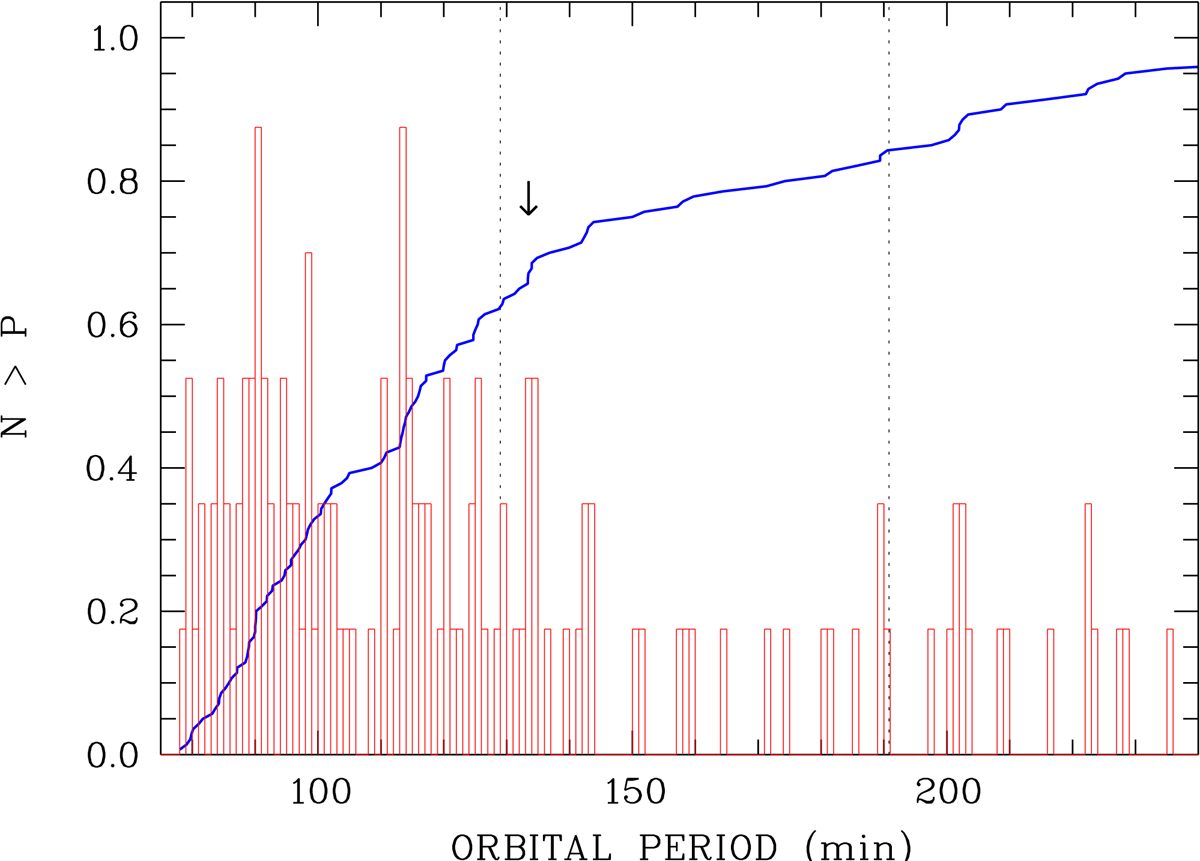
Normalised cumulative (blue) and binned (red) orbital period distribution of the polars. The location of J0005 is indicated with an arrow. the bin width is 1 min, the highest bin has five members. The ordinate scale is valid for the cumulative distribution. The dashed lines indicate the lower and upper bounds of the period gap as determined by Knigge et al. (2011).
Current usage metrics show cumulative count of Article Views (full-text article views including HTML views, PDF and ePub downloads, according to the available data) and Abstracts Views on Vision4Press platform.
Data correspond to usage on the plateform after 2015. The current usage metrics is available 48-96 hours after online publication and is updated daily on week days.
Initial download of the metrics may take a while.