Free Access
Fig. 3.
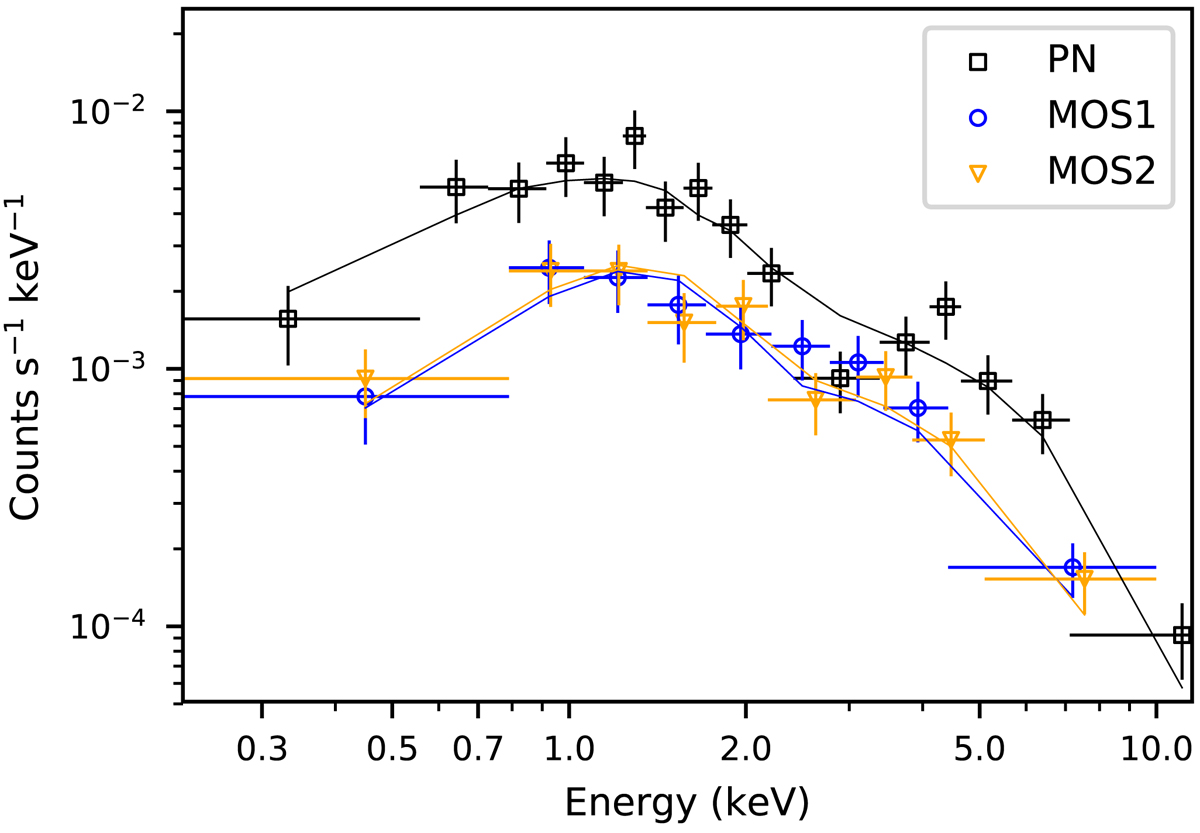
X-ray spectral fit of the average bright phase of J0005. The data are shown as points, and the model fit TBabs*apec are represented as solid lines.
Current usage metrics show cumulative count of Article Views (full-text article views including HTML views, PDF and ePub downloads, according to the available data) and Abstracts Views on Vision4Press platform.
Data correspond to usage on the plateform after 2015. The current usage metrics is available 48-96 hours after online publication and is updated daily on week days.
Initial download of the metrics may take a while.