Fig. 4.
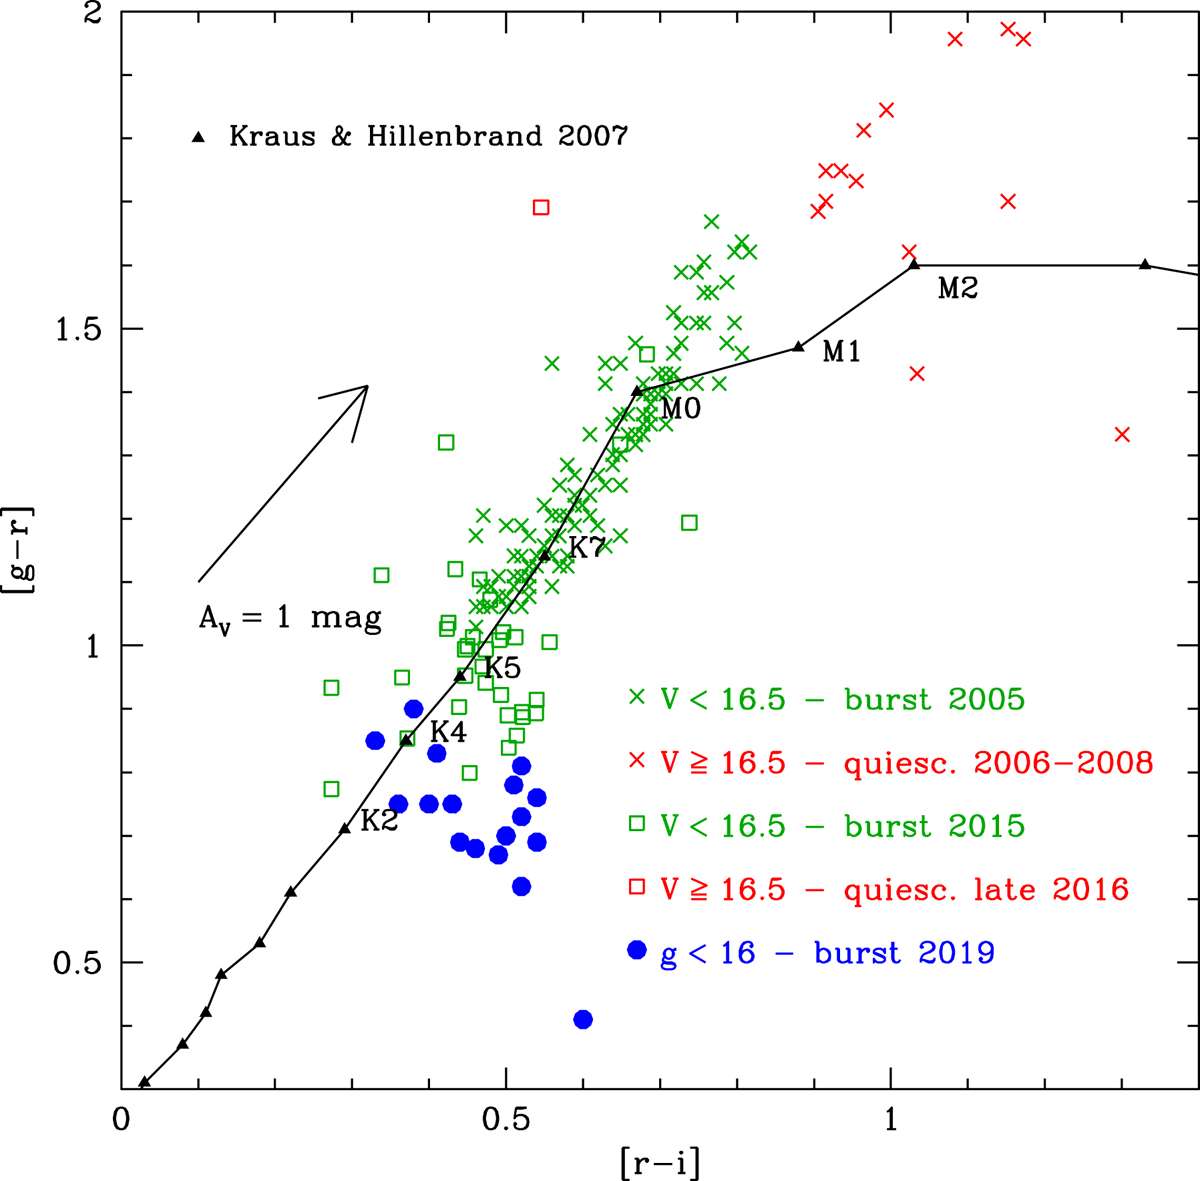
Diagram of [g − r] vs. [r − i]. The blue dots represent the points of the 2019 outburst. The green symbols indicate the points of the 2005 and 2015 outbursts (V < 16.5, crosses and open squares), while red symbols indicate the colors of the subsequent quiescence phases (V ≥ 16.5). Transformation equations between Johnson–Cousins and Sloan photometric systems have been applied. The continuous line indicates the locus of 400−600 Myr young stars (Kraus & Hillenbrand 2007). The black arrow denotes the extinction vector for AV = 1 mag, adopting the Cardelli et al. (1989) extinction law.
Current usage metrics show cumulative count of Article Views (full-text article views including HTML views, PDF and ePub downloads, according to the available data) and Abstracts Views on Vision4Press platform.
Data correspond to usage on the plateform after 2015. The current usage metrics is available 48-96 hours after online publication and is updated daily on week days.
Initial download of the metrics may take a while.