Free Access
Fig. 2.
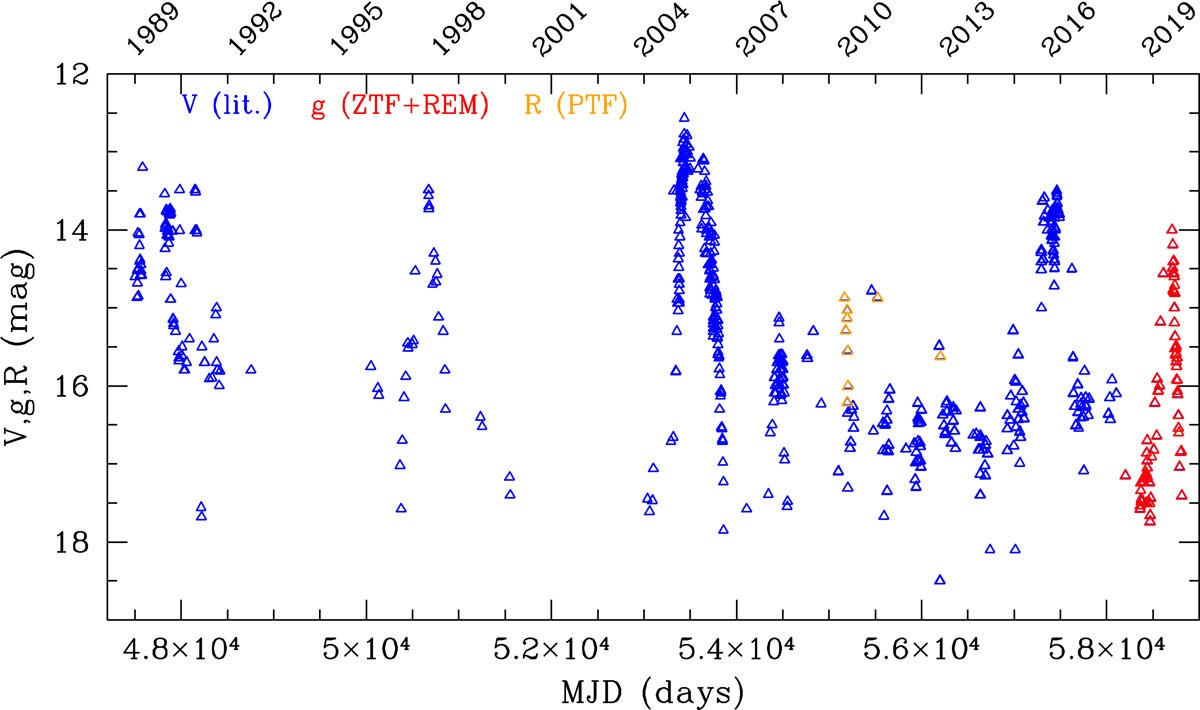
Thirty-year period of the optical light curve of V1118 Ori. V-band data taken from Giannini et al. (2017) and references therein (mainly Audard et al. 2010). R-band photometric points retrieved from the Palomar Transient Factory survey are depicted in orange. The ZTF+REM g-band data of the 2019 outburst are shown in red.
Current usage metrics show cumulative count of Article Views (full-text article views including HTML views, PDF and ePub downloads, according to the available data) and Abstracts Views on Vision4Press platform.
Data correspond to usage on the plateform after 2015. The current usage metrics is available 48-96 hours after online publication and is updated daily on week days.
Initial download of the metrics may take a while.