Fig. 1.
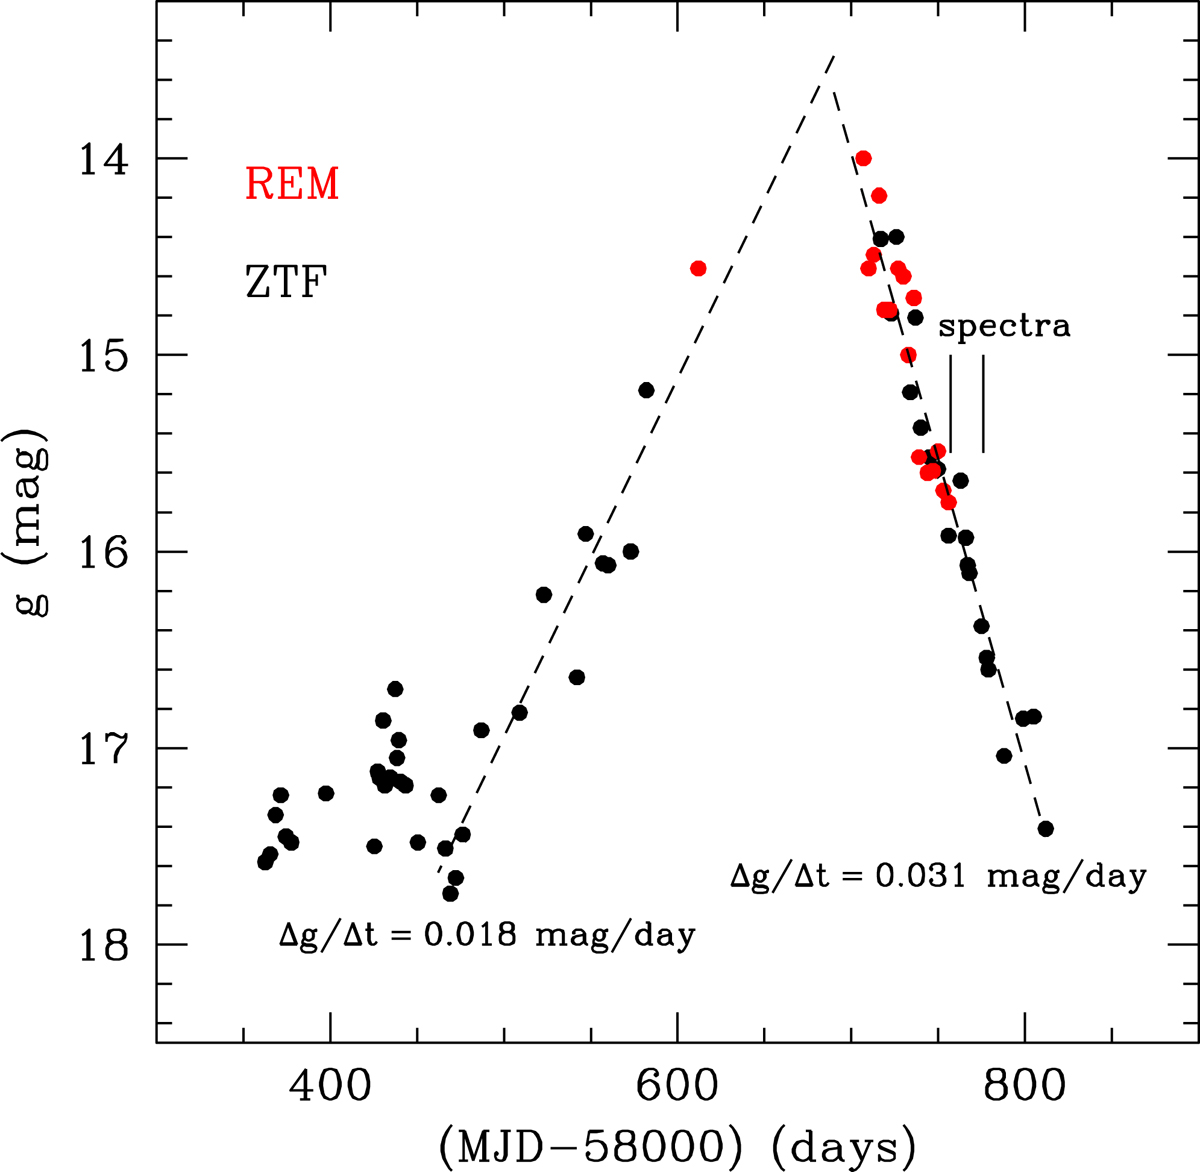
Zwicky Transient Facility (black) and REM (red) g-band photometric points of the 2019 outburst of V1118 Ori. The two dashed lines indicate the linear fits to the points of the rising and declining phases, with indicated the values of their slopes (mag day−1). Both have an uncertainty of 0.002 mag day−1. Two continuous segments indicate the dates of the spectroscopic observations.
Current usage metrics show cumulative count of Article Views (full-text article views including HTML views, PDF and ePub downloads, according to the available data) and Abstracts Views on Vision4Press platform.
Data correspond to usage on the plateform after 2015. The current usage metrics is available 48-96 hours after online publication and is updated daily on week days.
Initial download of the metrics may take a while.