Fig. 9.
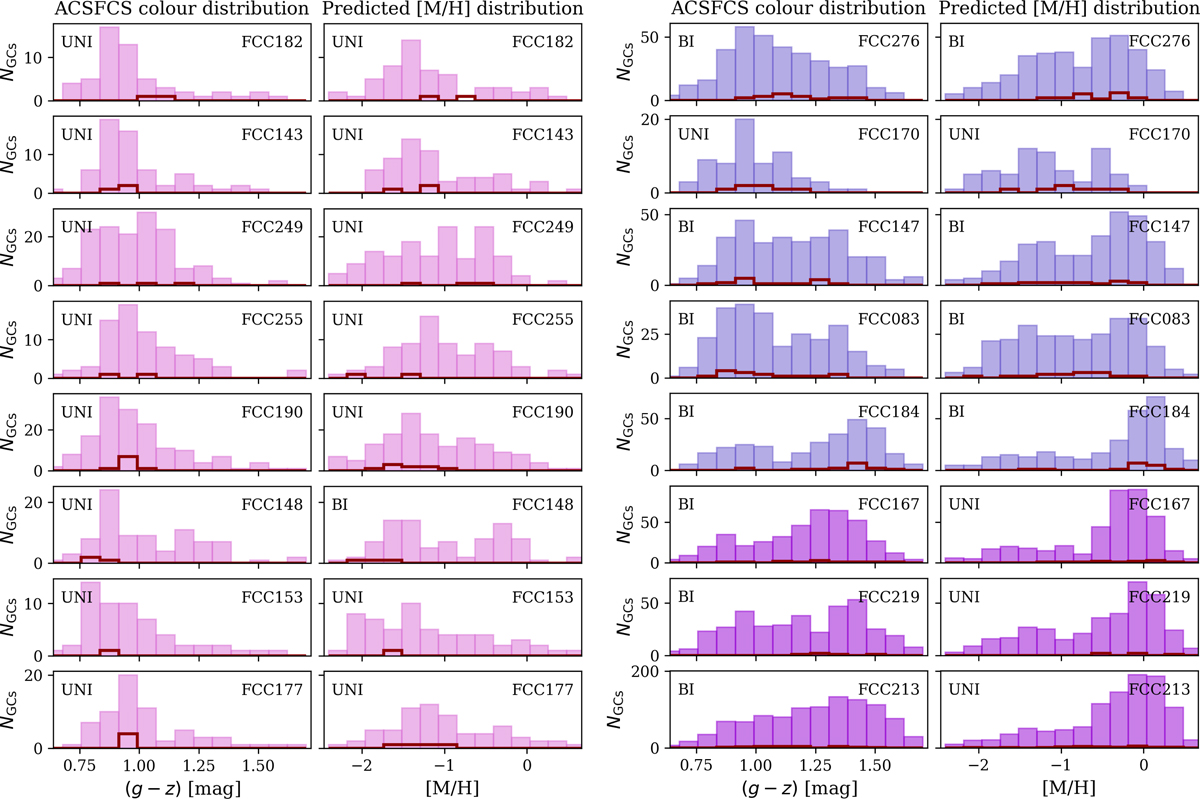
Colour (first and third panel) and metallicity (second and fourth panel) distribution for 16 F3D galaxies that have a sufficient number of GC candidates in the ACSFCS catalogue from Jordán et al. (2015) to create a well sampled distribution. MDFs were inferred from the colour distributions using Eq. (3) with the best-fit parameters from our default CZR (Table A.2). The histograms are coloured based on the stellar mass of the host using three mass bins: log(MHost/M⊙) < 10 (pink), 10 ≤ log(MHost/M⊙) < 11 (blue), and log(MHost/M⊙) ≥ 11 (purple). The red histograms show the GCs in our sample. In the top left corner of each panel, the distributions are classified as bimodal (“BI”) or unimodal (“UNI”) based on the GMM test described in the text.
Current usage metrics show cumulative count of Article Views (full-text article views including HTML views, PDF and ePub downloads, according to the available data) and Abstracts Views on Vision4Press platform.
Data correspond to usage on the plateform after 2015. The current usage metrics is available 48-96 hours after online publication and is updated daily on week days.
Initial download of the metrics may take a while.