Fig. 7.
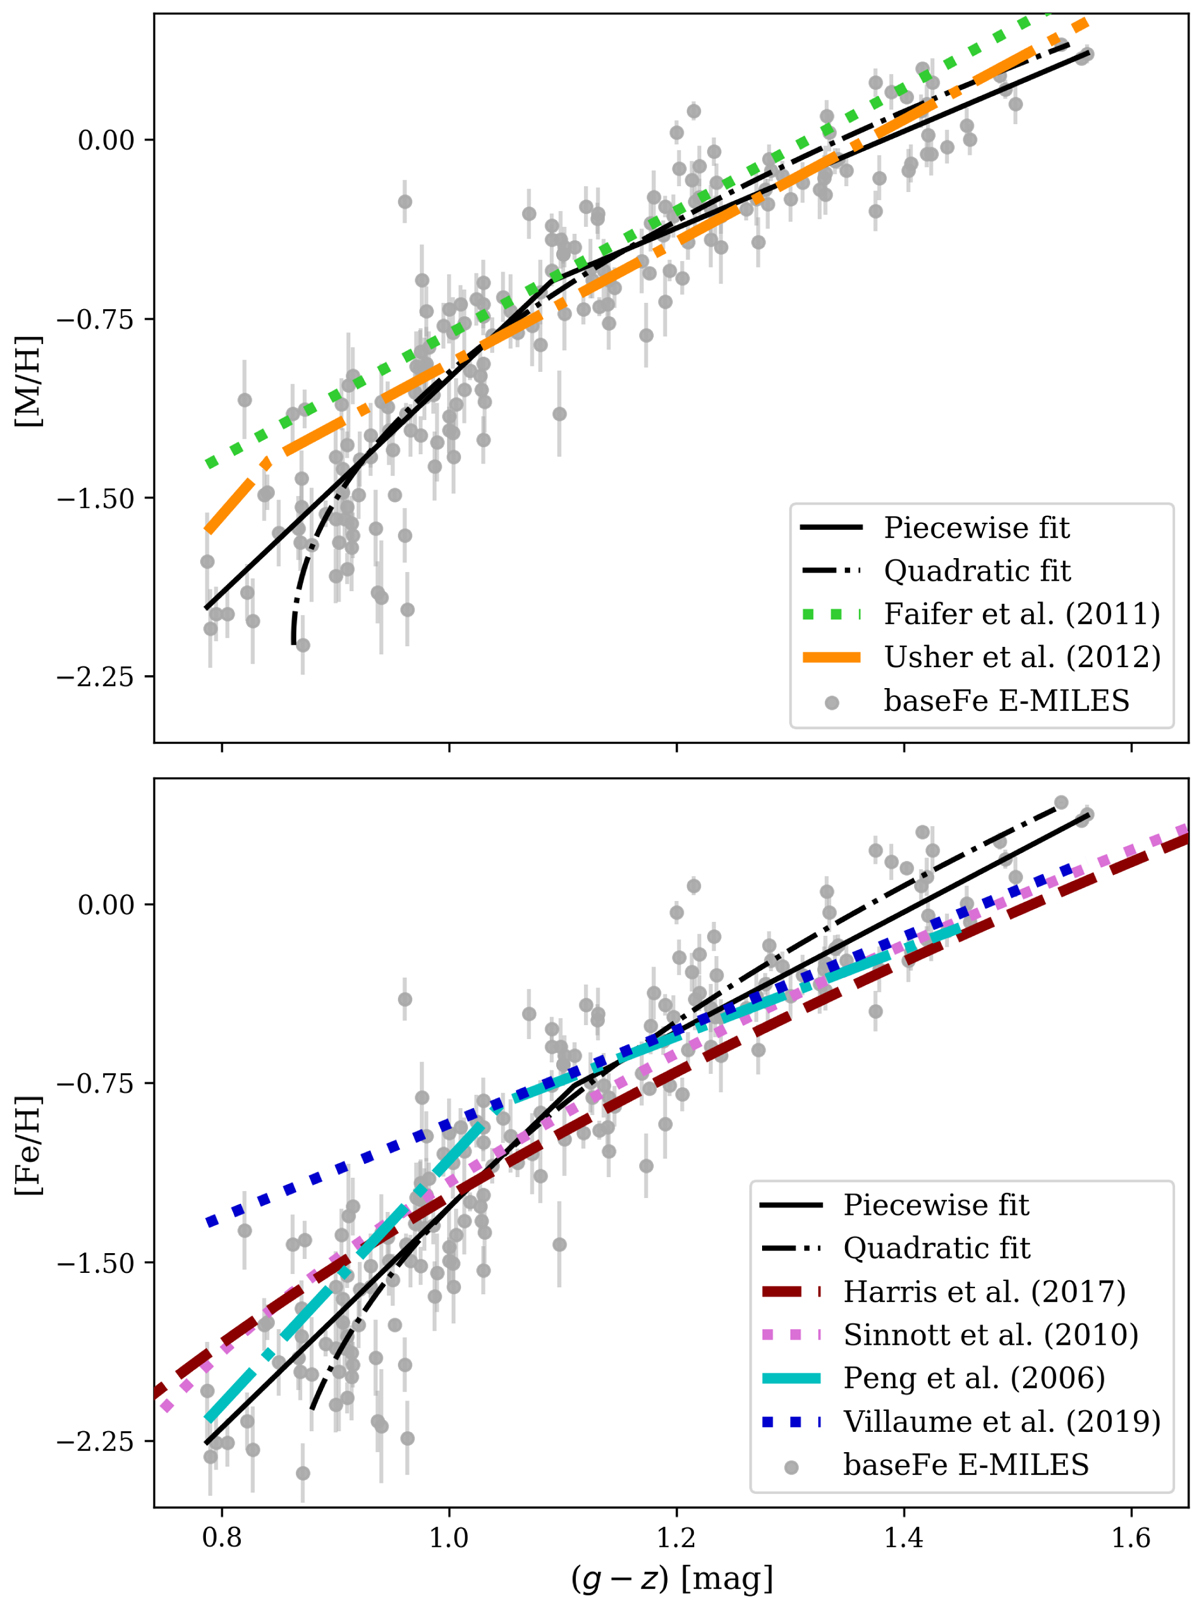
Our CZR in comparison to literature results. We differentiate between relations based on total metallicities (top) and iron metallicities (bottom). The black curves give our fits (Table A.2). The green line in the top plot refers to the relation of Faifer et al. (2011) of five massive ETGs and the orange line shows the piecewise relation of Usher et al. (2012). Both relations were converted from (g − i) colours to (g−z) using the translations given in Usher et al. (2012). Bottom panel: quadratic relations of Sinnott et al. (2010) and Harris et al. (2017) (pink and red lines) obtained for GCs of Centaurus A and linear relation of Villaume et al. (2019) based on metallicities of GCs of M 87 (dark blue line). The bright blue line shows the piecewise relation from Peng et al. (2006) obtained from a diverse sample of literature metallicities.
Current usage metrics show cumulative count of Article Views (full-text article views including HTML views, PDF and ePub downloads, according to the available data) and Abstracts Views on Vision4Press platform.
Data correspond to usage on the plateform after 2015. The current usage metrics is available 48-96 hours after online publication and is updated daily on week days.
Initial download of the metrics may take a while.