Fig. 5.
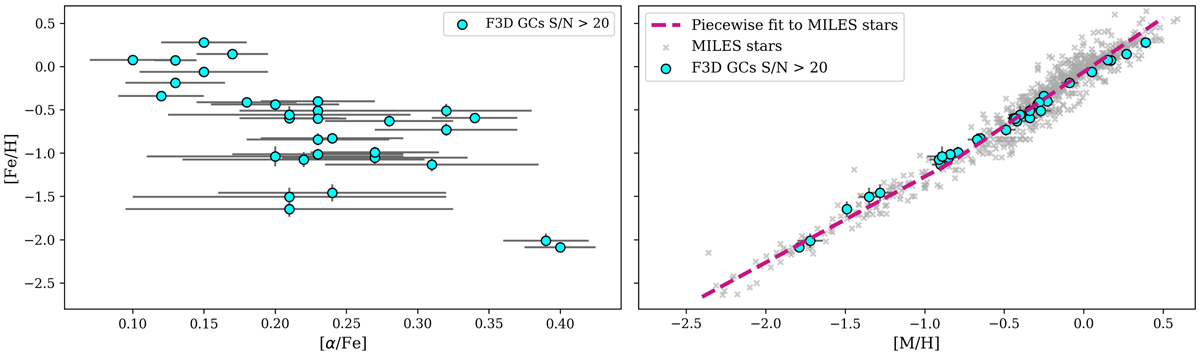
Abundance pattern of F3D GCs. [Fe/H] in relation to [α/Fe] (left) and [M/H] (right). Right panel: the grey crosses show the distribution for the MILES stars that were used to construct the E-MILES models and the purple line is a least-square fit with a piecewise linear function (Eq. (3)) to the MILES stars. The cyan circles show the brightest F3D GCs in our sample.
Current usage metrics show cumulative count of Article Views (full-text article views including HTML views, PDF and ePub downloads, according to the available data) and Abstracts Views on Vision4Press platform.
Data correspond to usage on the plateform after 2015. The current usage metrics is available 48-96 hours after online publication and is updated daily on week days.
Initial download of the metrics may take a while.