Fig. 2.
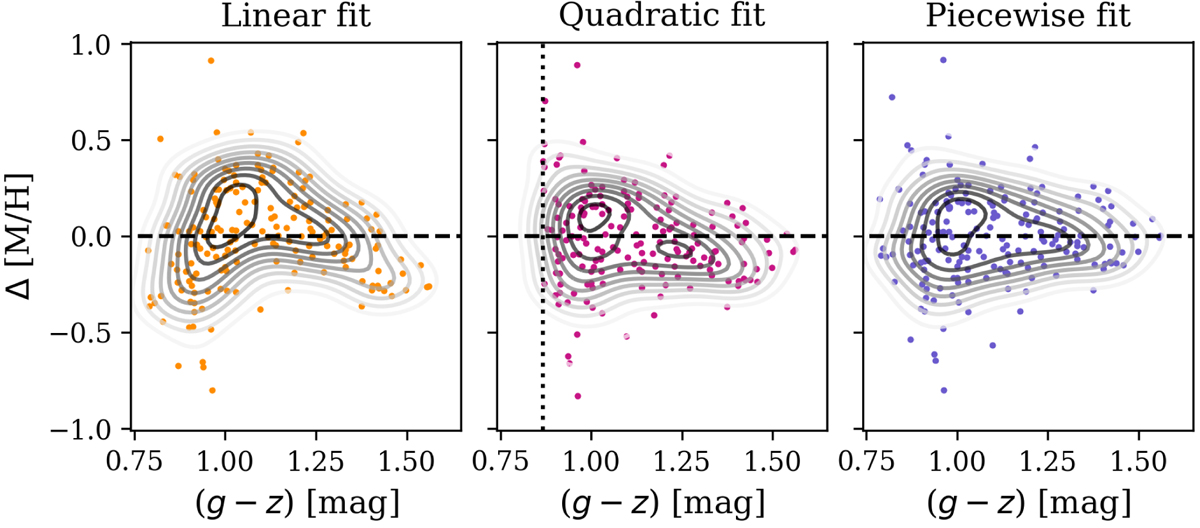
Residuals when fitting the colour–metallicity distribution shown in Fig. 1 with a linear (left), a quadratic (middle) and piecewise linear function (right), respectively. Coloured points show the observed scatter and the contours give a kernel density estimation using an arbitrary Gaussian kernel for visualisation of the residual shape. The dotted vertical line in the middle panel shows where the quadratic model diverges.
Current usage metrics show cumulative count of Article Views (full-text article views including HTML views, PDF and ePub downloads, according to the available data) and Abstracts Views on Vision4Press platform.
Data correspond to usage on the plateform after 2015. The current usage metrics is available 48-96 hours after online publication and is updated daily on week days.
Initial download of the metrics may take a while.