Fig. 1.
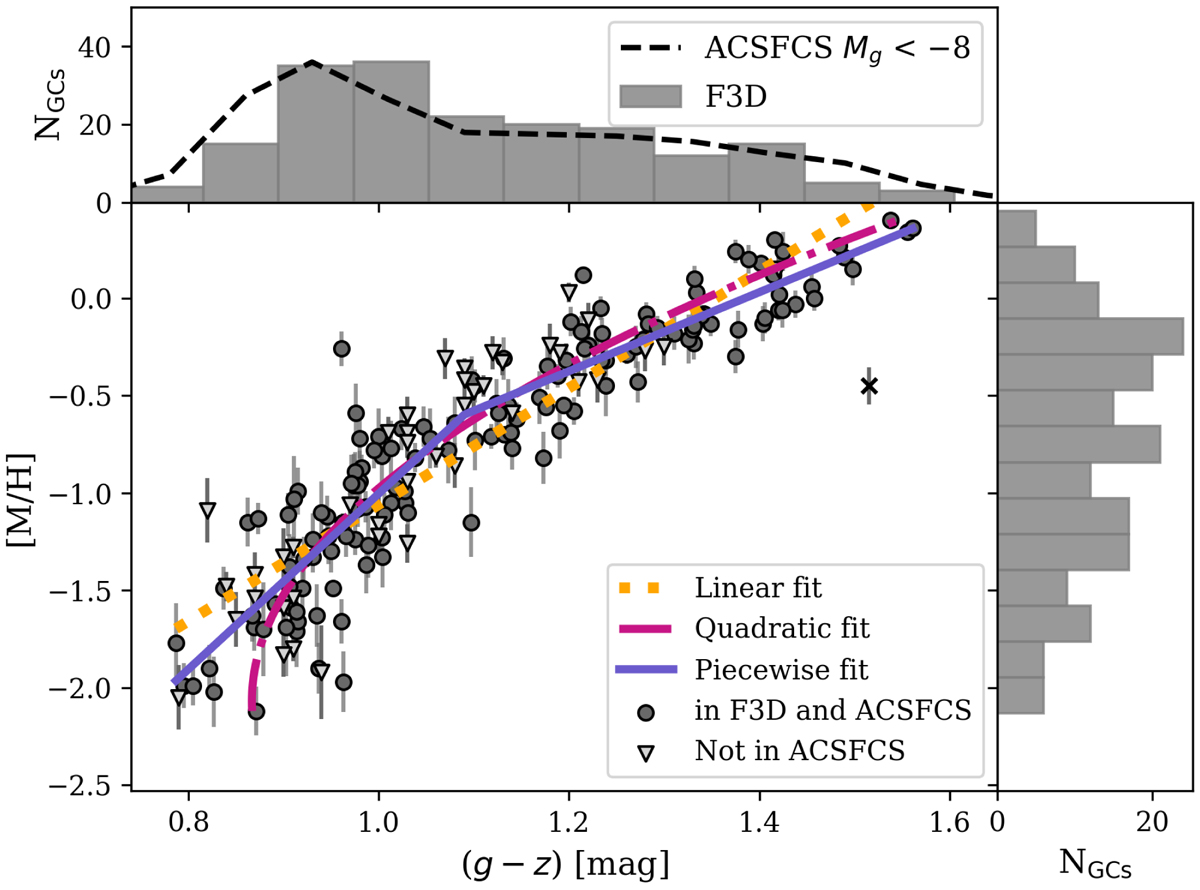
Colour–metallicity distribution of F3D GCs. Spectroscopic GC metallicities from full spectral fitting versus (g−z) colour. Filled circles and triangles refer to GCs with and without ACSFCS (g−z) colours from Jordán et al. (2015), respectively. For the latter, we obtained the colour from the MUSE spectrum directly. The orange, pink and purple lines give the fit using the linear, quadratic or piecewise function (Eqs. (1)–(3)). The corresponding residuals are found in Fig. 2. As described in the text, we excluded an outlier from the fit marked by a cross. Separate distributions of colour and metallicities are shown on the top and the right-hand side. Top panel: we included the histogram from the full ACSFCS GC sample after applying a magnitude cut corresponding to our sample.
Current usage metrics show cumulative count of Article Views (full-text article views including HTML views, PDF and ePub downloads, according to the available data) and Abstracts Views on Vision4Press platform.
Data correspond to usage on the plateform after 2015. The current usage metrics is available 48-96 hours after online publication and is updated daily on week days.
Initial download of the metrics may take a while.