Fig. 5.
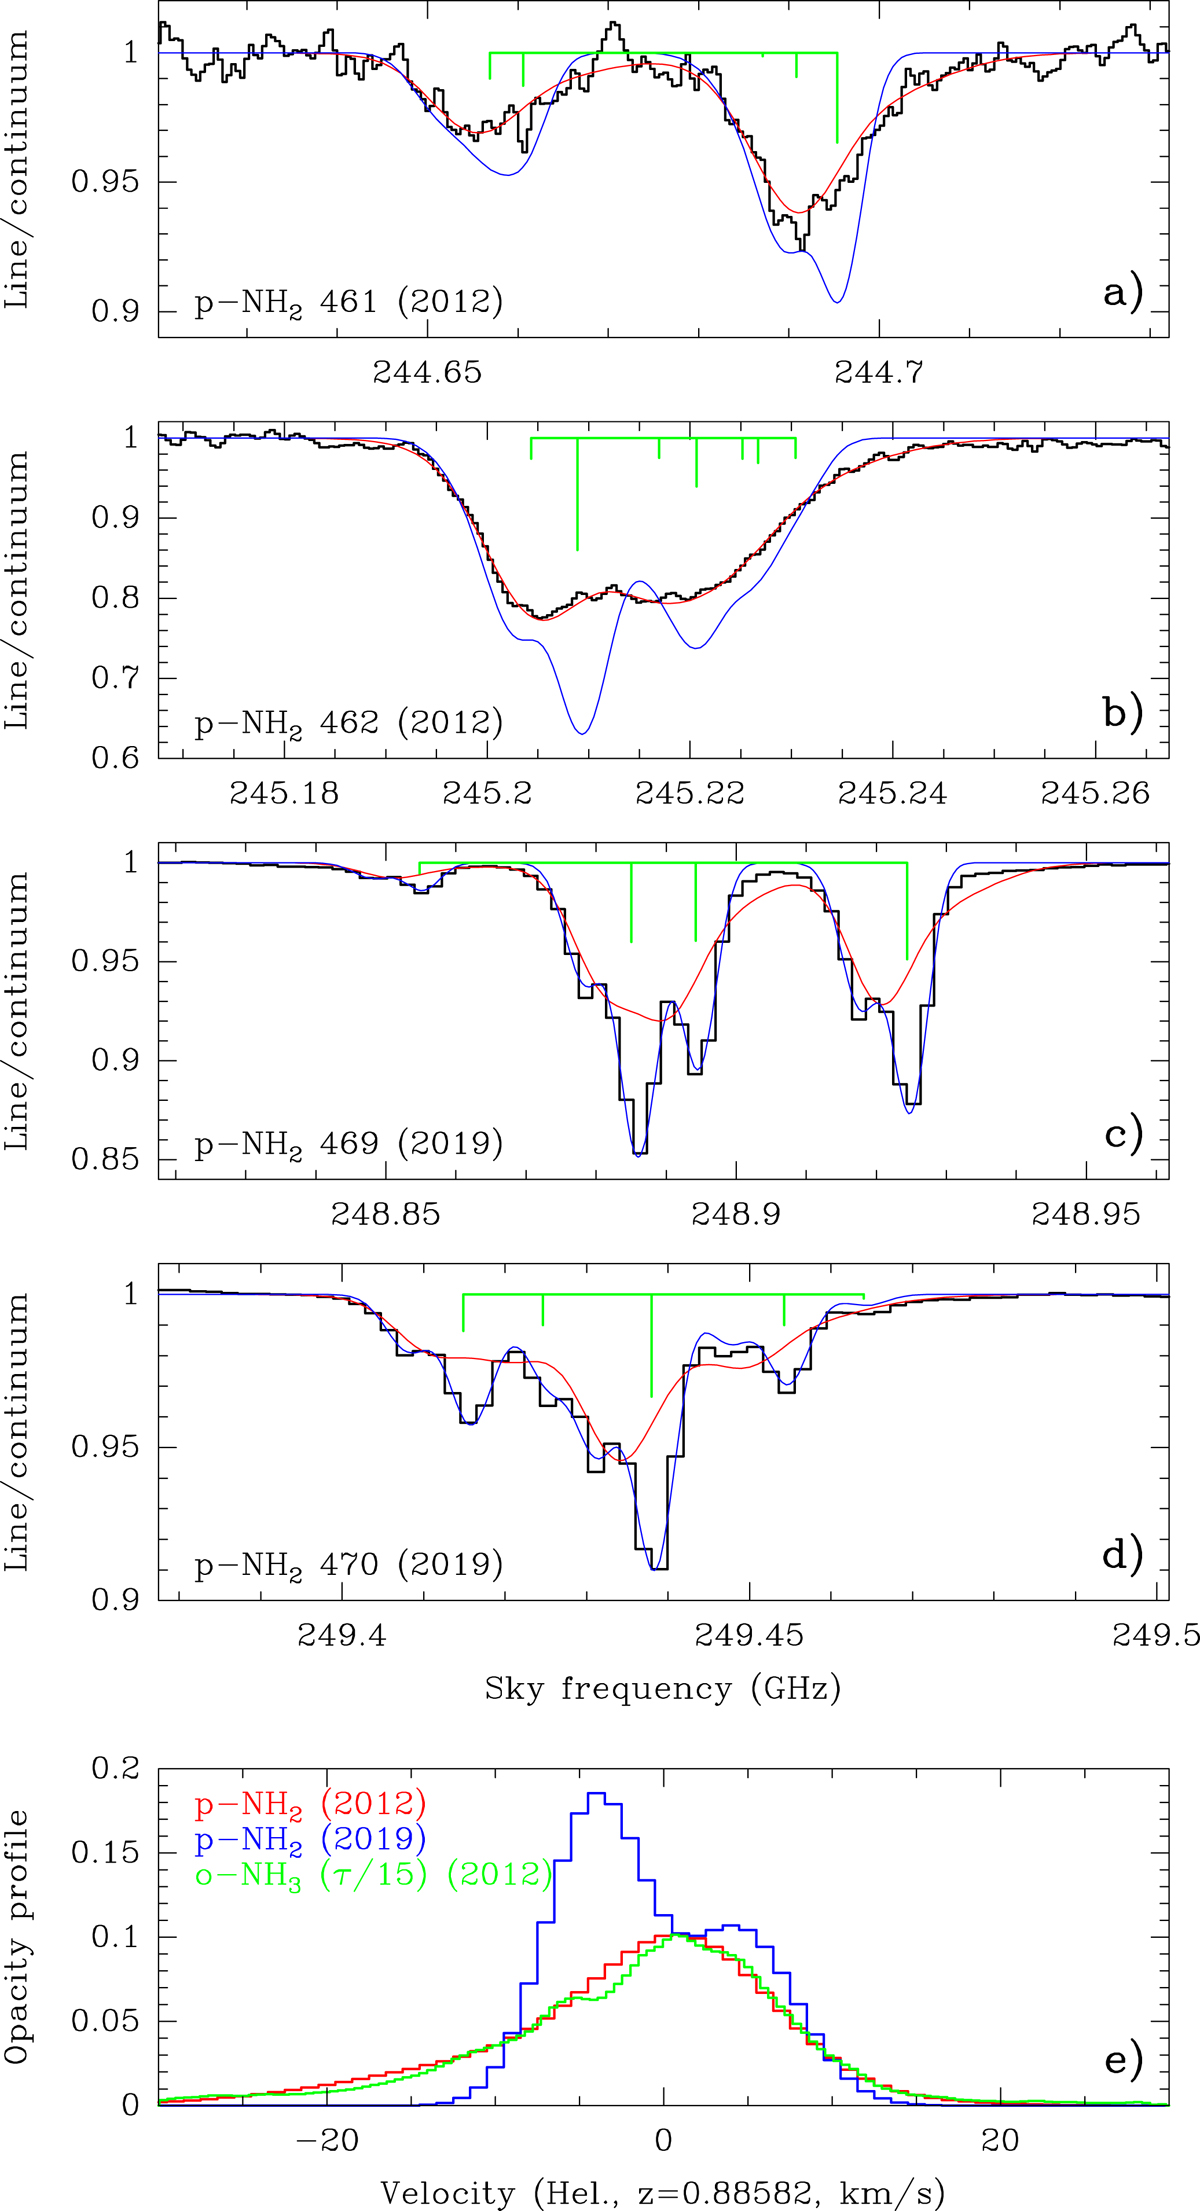
Panels a–d: spectra of the different groups of fundamental hyperfine structure transitions of the para-NH2 (11, 0–10, 1) line observed with ALMA at different epochs toward the SW image of PKS 1830−211. The hyperfine structure is shown on top of each group in green. The 2012 and 2019 profiles were fitted each separately with two Gaussian velocity components and the synthetic spectra corresponding to the best fits are shown in red (matching the observed spectrum in 2012) and blue (matching the observed spectrum in 2019). Panel e: 2012 and 2019 opacity profiles in velocity fitted for p-NH2 (i.e., profiles deconvolved from the hyperfine structure and normalized for an equivalent transition of line strength = 1), with the same color code as in (a–d), as well as the profile of the o-NH3 (10–00) transition (in green) observed in 2012 by Muller et al. (2014), scaled to the peak of the p-NH2 2012 profile.
Current usage metrics show cumulative count of Article Views (full-text article views including HTML views, PDF and ePub downloads, according to the available data) and Abstracts Views on Vision4Press platform.
Data correspond to usage on the plateform after 2015. The current usage metrics is available 48-96 hours after online publication and is updated daily on week days.
Initial download of the metrics may take a while.