Fig. 1.
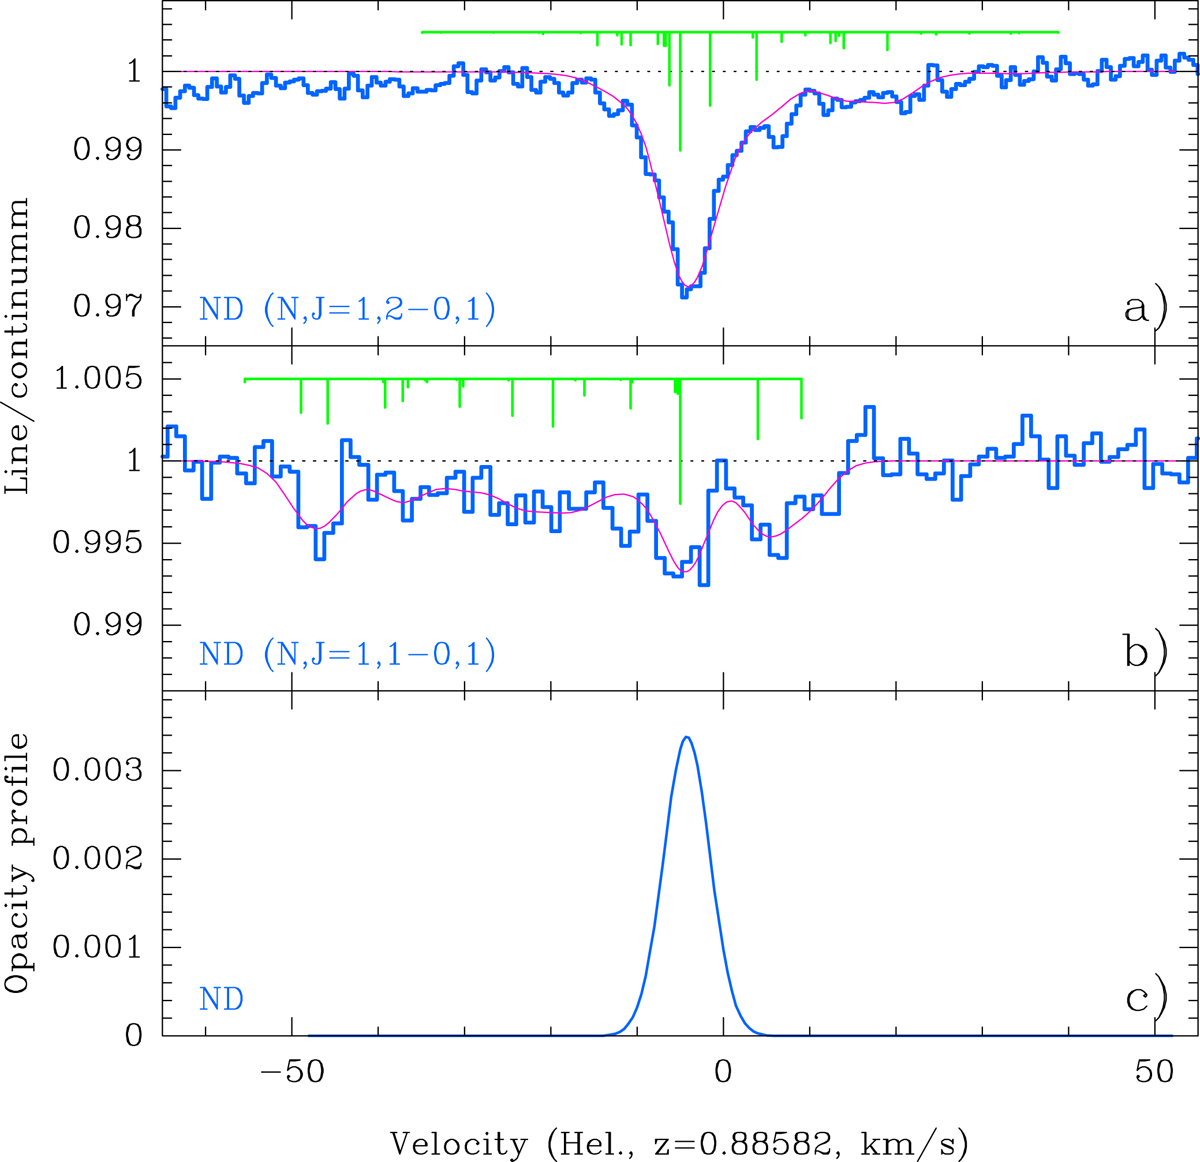
Spectra of the ND (N = 1–0, J = 2–1) (a) and (N = 1–0, J = 1–1) (b) lines toward the SW image of PKS 1830−211, observed with ALMA in July 2019. The hyperfine structure and the best fits with one single Gaussian velocity component are shown. c: corresponding ND opacity profile fitted with one Gaussian velocity component (see Table 3), normalized for an equivalent transition of line strength = 1.
Current usage metrics show cumulative count of Article Views (full-text article views including HTML views, PDF and ePub downloads, according to the available data) and Abstracts Views on Vision4Press platform.
Data correspond to usage on the plateform after 2015. The current usage metrics is available 48-96 hours after online publication and is updated daily on week days.
Initial download of the metrics may take a while.