Fig. 5.
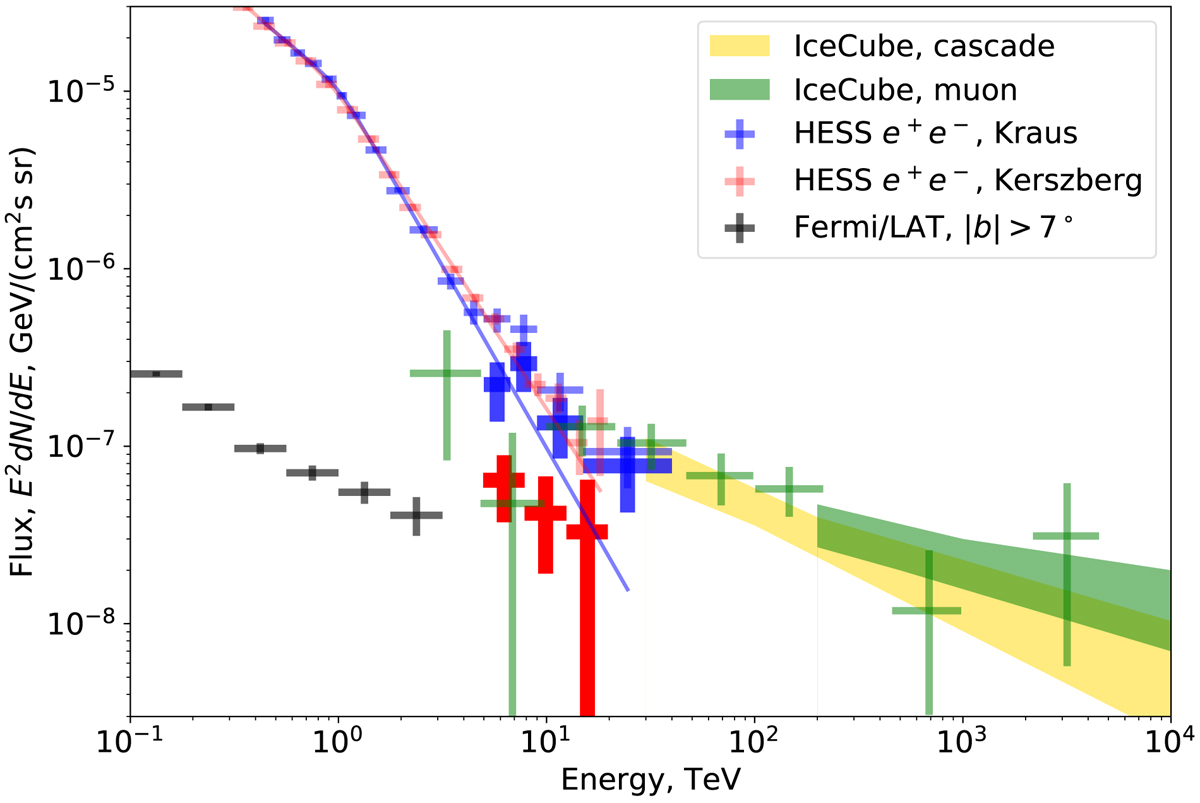
High-energy excesses (blue and red data points) over power-law models (light blue and red lines) of the HESS electron spectrum measurements by Kraus (2018), Kerszberg et al. (2017), and Kerszberg (2017) (shown by thin light blue and red data points). The thin dark grey data points below 3 TeV show Fermi/LAT measurements of the Galactic diffuse flux from the Galactic latitude region |b| > 7°, extracted in the same way as in the analysis of Neronov & Semikoz (2020). Yellow and green butterflies show IceCube astrophysical neutrino flux spectra derived from the analysis of cascade and through-going muon neutrino (Williams 2019) event selections. Green data points show the neutrino spectrum reported by IceCube Collaboration (2017).
Current usage metrics show cumulative count of Article Views (full-text article views including HTML views, PDF and ePub downloads, according to the available data) and Abstracts Views on Vision4Press platform.
Data correspond to usage on the plateform after 2015. The current usage metrics is available 48-96 hours after online publication and is updated daily on week days.
Initial download of the metrics may take a while.