Fig. 2.
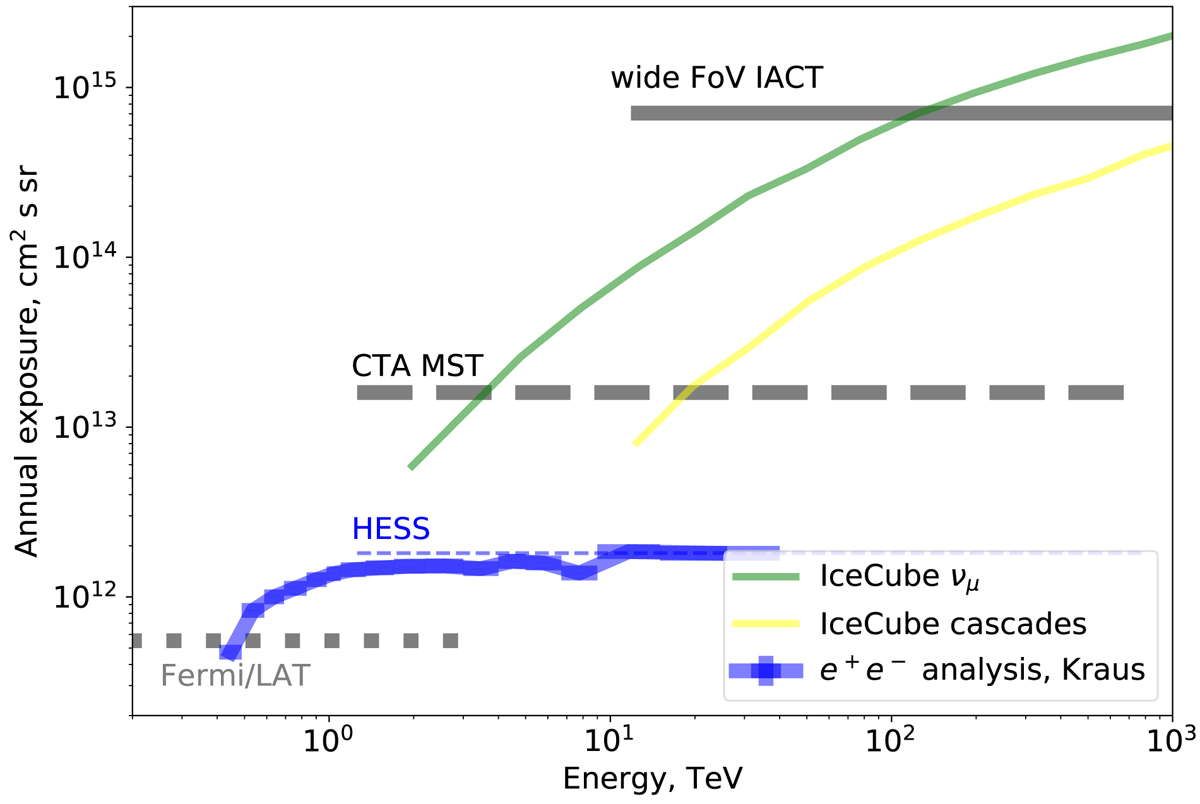
Annual exposure of different space- and ground-based telescopes for diffuse flux measurements. The thick blue histogram shows the exposure of the HESS electron spectrum analysis deduced from the event statistics reported by Kraus (2018). The thin dashed blue line corresponds to the geometrical exposure limit imposed by the distance and angular cuts adopted in the analysis. The medium-width yellow and green solid curves show the IceCube exposure in the cascade mode from Aartsen et al. (2015) and in the through-going muon neutrino mode from Aartsen et al. (2016). The thick horizontal short-dashed line shows yearly exposure attainable with Fermi/LAT Atwood et al. (2009). The thick horizontal long-dashed and solid lines show the exposure achievable with the MST sub-array of CTA and with a dedicated wide-FoV IACT system for the event selection with the same cuts as in the HESS electron spectrum analysis.
Current usage metrics show cumulative count of Article Views (full-text article views including HTML views, PDF and ePub downloads, according to the available data) and Abstracts Views on Vision4Press platform.
Data correspond to usage on the plateform after 2015. The current usage metrics is available 48-96 hours after online publication and is updated daily on week days.
Initial download of the metrics may take a while.