Fig. 4
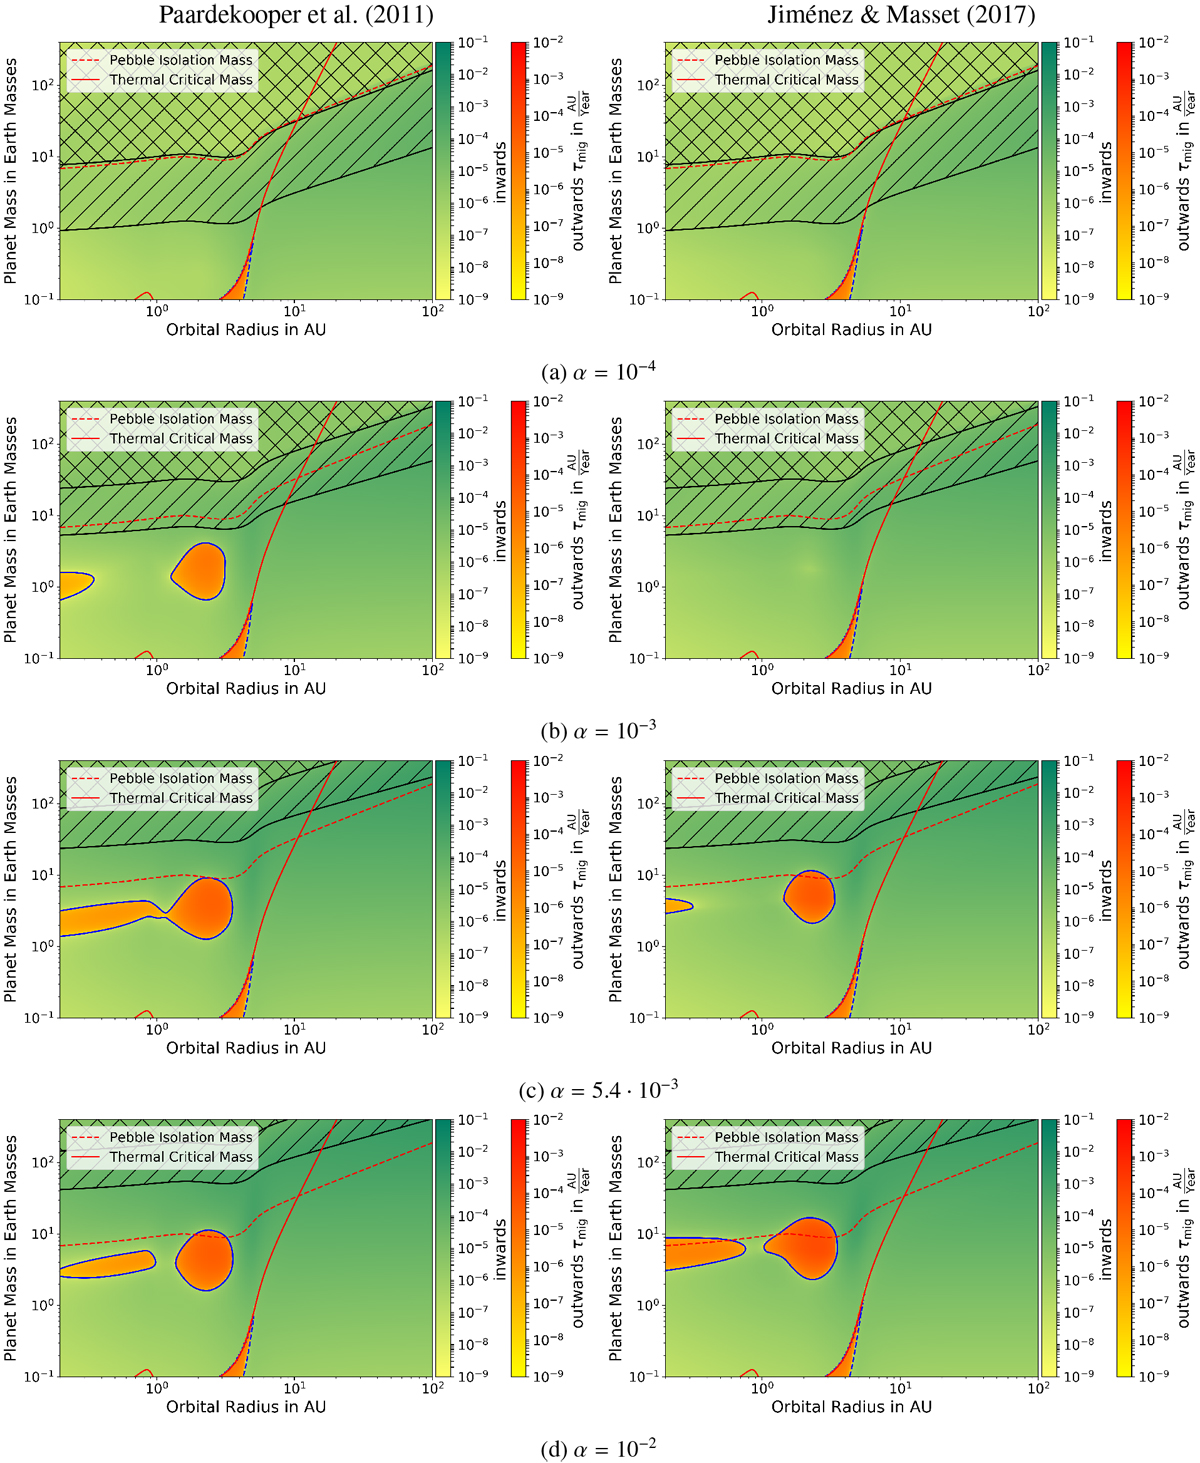
Migration maps after 1 Myr with different α-viscosity values for the calculation of migration timescales and the gap parameter. The left plots show the Paardekooper et al. (2011) formula and the right ones the Jiménez & Masset (2017) formula. Hatched regions mark the transition to type II migration, while planets in the cross-hatched areas are migrating completely in the type II regime. Regions of outwards migration that are caused by the thermal torque, which is calculated with an accretion rate of
![]() , are outlined by dashed blue lines, while regions of outwards migration inside solid blue lines are due to the original torque formulae. Outwards migration in the original formulae is caused by the torques originating from the corotation region (Paardekooper et al. 2011) or by the temperature torque (Jiménez & Masset 2017). As type II migration depends on the disk properties rather the type I torque formula, the cross-hatched regions are identical between the corresponding left and right plots.
, are outlined by dashed blue lines, while regions of outwards migration inside solid blue lines are due to the original torque formulae. Outwards migration in the original formulae is caused by the torques originating from the corotation region (Paardekooper et al. 2011) or by the temperature torque (Jiménez & Masset 2017). As type II migration depends on the disk properties rather the type I torque formula, the cross-hatched regions are identical between the corresponding left and right plots.
Current usage metrics show cumulative count of Article Views (full-text article views including HTML views, PDF and ePub downloads, according to the available data) and Abstracts Views on Vision4Press platform.
Data correspond to usage on the plateform after 2015. The current usage metrics is available 48-96 hours after online publication and is updated daily on week days.
Initial download of the metrics may take a while.