Fig. 2
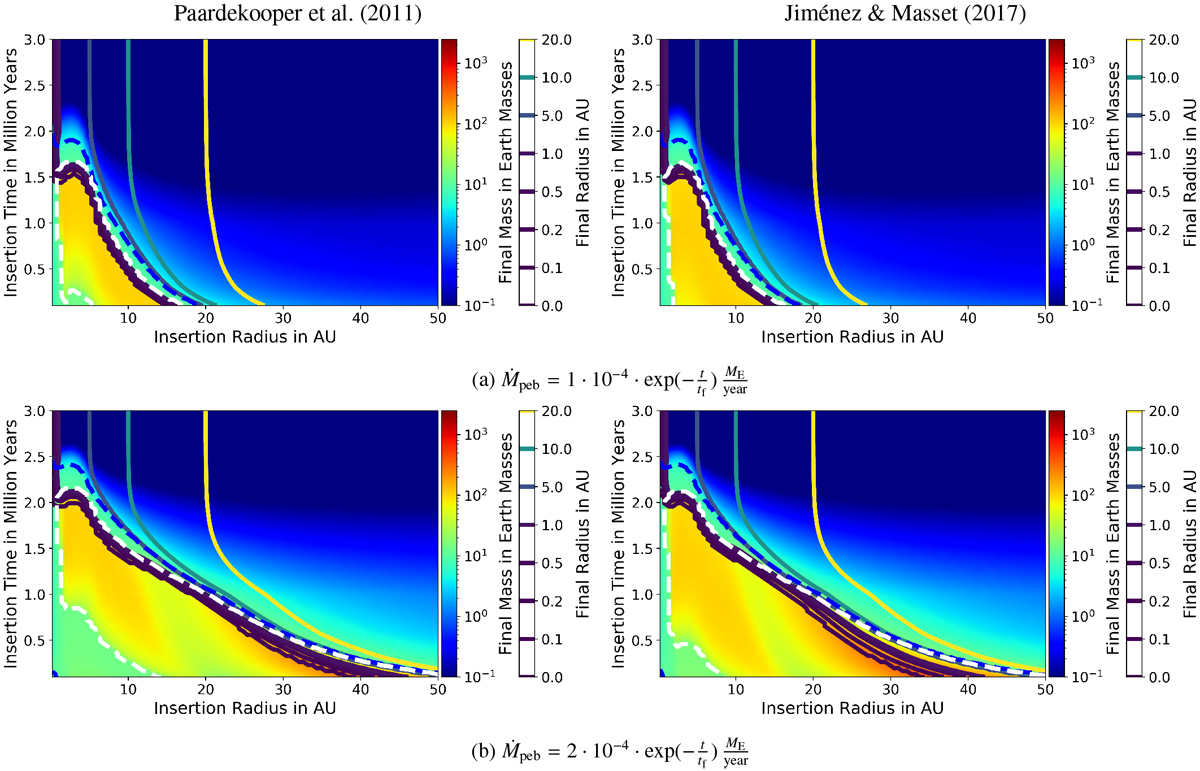
Planet formation maps with different pebble fluxes in the disk. The axes display where and when a planetary embryo has been inserted in the disk. The color codes how massive the planets grow, while the solid lines outline its final orbitalradius. Planets that are below the dashed blue line have reached pebble isolation mass and accrete gas. Planets that are interior to the dashed white line have reached runaway gas accretion and can grow very massive. Ṁpeb marks the pebble flux through the disk, which decreases exponentially over time. Differences between the formulae in terms of impact on planet formation are small. As the pebble density in the outer disk is small, planets that are inserted there do not grow much.
Current usage metrics show cumulative count of Article Views (full-text article views including HTML views, PDF and ePub downloads, according to the available data) and Abstracts Views on Vision4Press platform.
Data correspond to usage on the plateform after 2015. The current usage metrics is available 48-96 hours after online publication and is updated daily on week days.
Initial download of the metrics may take a while.