Fig. E.4
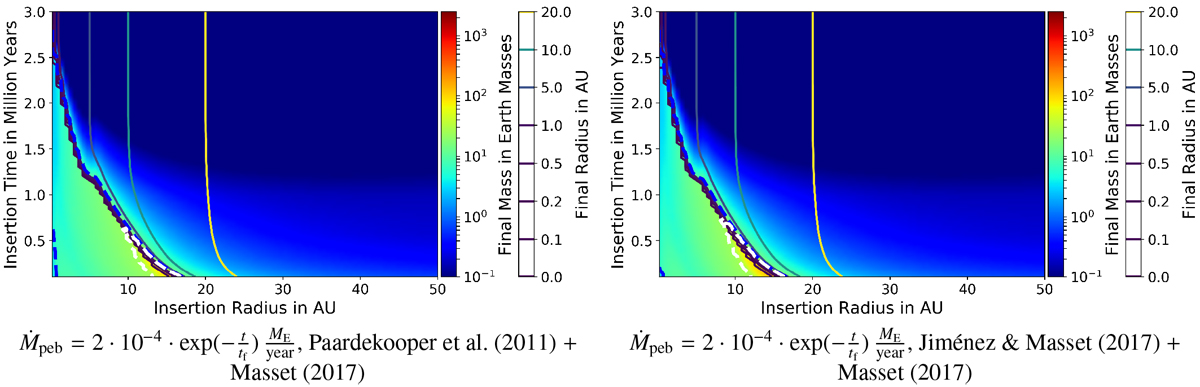
Planet evolution maps in the Ida et al. (2016) disk model at α = 5.4 × 10⁻³. As in Fig. 2, planets that are below the dashed blue line have reached pebble isolation mass and accrete gas. Planets that are interior to the dashed white line have reached runaway gas accretion and can grow very massive. The pebble flux is
![]() in all plots. As in the Bitsch et al. (2015b) disk, the formulae produce really similar results, however planets grow much lighter with the same pebble fluxes in the Ida et al. (2016) model due to the region of outwards migration from corotation torques being smaller.
in all plots. As in the Bitsch et al. (2015b) disk, the formulae produce really similar results, however planets grow much lighter with the same pebble fluxes in the Ida et al. (2016) model due to the region of outwards migration from corotation torques being smaller.
Current usage metrics show cumulative count of Article Views (full-text article views including HTML views, PDF and ePub downloads, according to the available data) and Abstracts Views on Vision4Press platform.
Data correspond to usage on the plateform after 2015. The current usage metrics is available 48-96 hours after online publication and is updated daily on week days.
Initial download of the metrics may take a while.