Fig. E.3
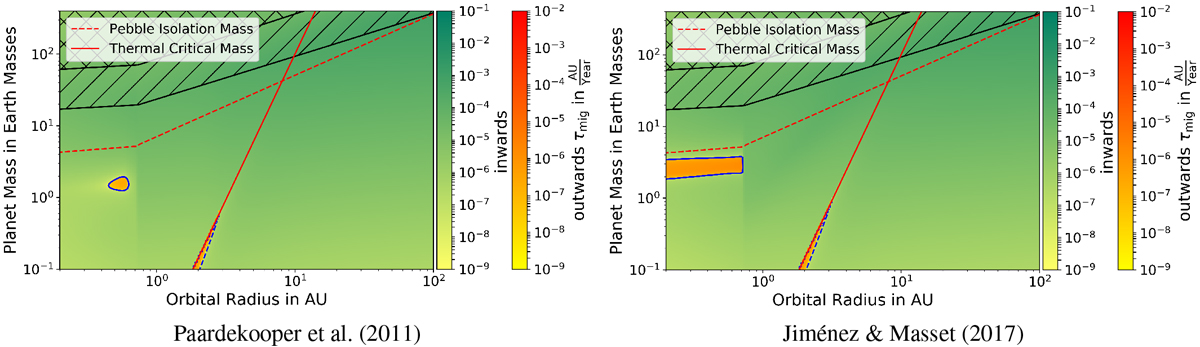
Migration maps in the Ida et al. (2016) disk model after 1 Myr at α = 5.4× 10⁻³. Like in Fig. 4, hatched regions mark the transition to type II migration, while planets in the cross-hatched areas are migrating completely in the type II regime and regions of outwards migration that are caused by the thermal torque are outlined by dashed blue lines, while regions of outwards migration inside solid blue lines are due to the original torque formulae. Compared to the corresponding plots in the Bitsch et al. (2015b) disk (Fig. 4c), less outwards migration takes place. This is particularly true for the Paardekooper et al. (2011) formula and outwards migration due to the heating torque.
Current usage metrics show cumulative count of Article Views (full-text article views including HTML views, PDF and ePub downloads, according to the available data) and Abstracts Views on Vision4Press platform.
Data correspond to usage on the plateform after 2015. The current usage metrics is available 48-96 hours after online publication and is updated daily on week days.
Initial download of the metrics may take a while.