Fig. A.1
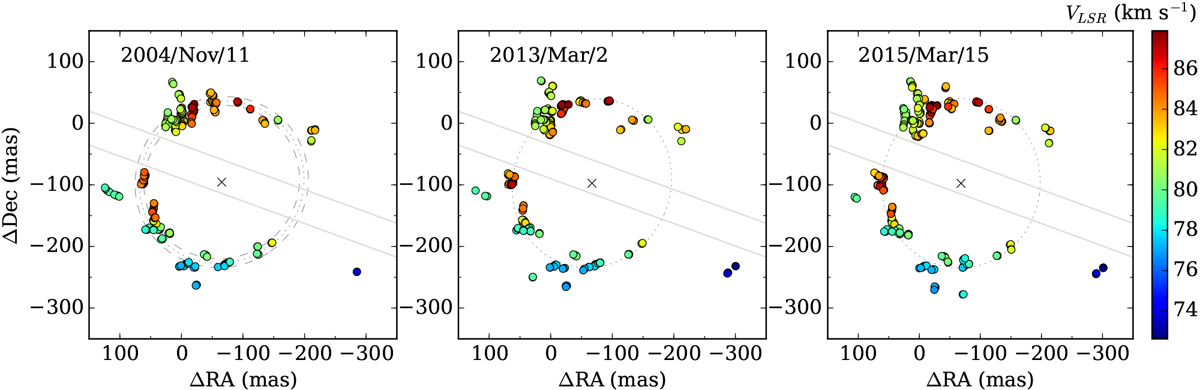
Three epoch EVN maps of 6.7 GHz methanol maser spots detected in G23.657–00.127. The coordinates are relative to the brightest spots in each epoch (Table 1). The colours of circles relate to the LSR velocities as shown on the right bar. The dotted ellipses trace the best fits to all spots, except the SW blue-shifted ones, detected at each epoch (Table 2). The dashed ellipses indicate the widthof the ring as derived in the first epoch data (Bartkiewicz et al. 2005). The grey lines at PA ~ 80° (N to E) delineate the emission-free part of the maser ring discussed in Sect. 4.2
Current usage metrics show cumulative count of Article Views (full-text article views including HTML views, PDF and ePub downloads, according to the available data) and Abstracts Views on Vision4Press platform.
Data correspond to usage on the plateform after 2015. The current usage metrics is available 48-96 hours after online publication and is updated daily on week days.
Initial download of the metrics may take a while.