Fig. 1
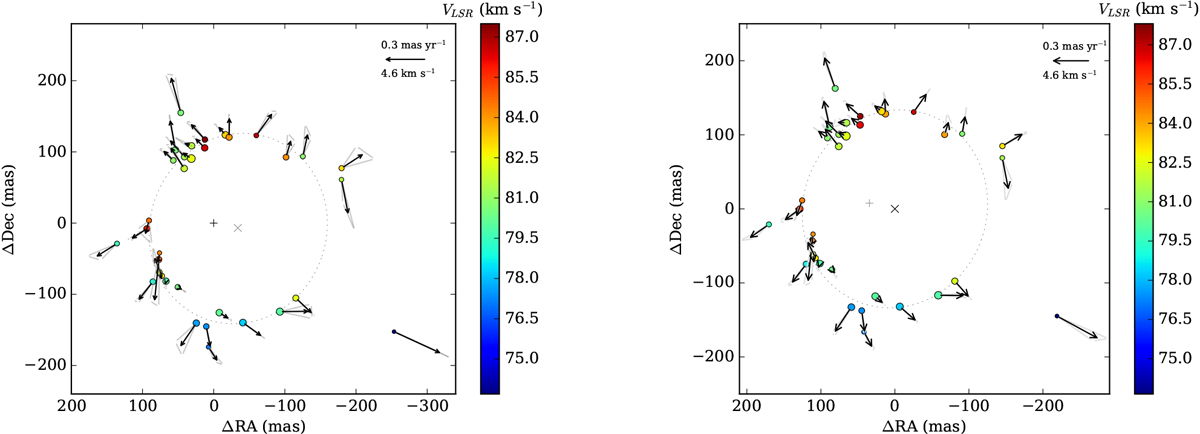
Left: proper motions of 6.7 GHz methanol maser cloudlets in G23.657–00.127 as measured relative to the centre of motion. The centre of motion, defined in Sect. 2, is marked by the plus sign. Its relative coordinates to the brightest spot in E1, as given in Table 1, are (−31.6145 mas, −88.7120 mas). The cloudlets are marked by filled circles, their sizes are proportional to the peak brightness at the first epoch. Their colours correspond to the local standard velocity scale presented in the vertical wedge. The black arrows indicate the best fits of the relative proper-motion for the three epoch data with the uncertainties marked by the grey triangles. The dotted ellipse traces the best flux-weighted fit to all cloudlets (except the SW blue-shifted one) as detected at E1. The centre of the ellipse is marked by the cross (Table 2). Right: proper motions estimated via ellipse fittings and aligning their centres. The (0,0) point, marked by the plus sign, corresponds to the centre of the best fitted ellipse to E1 (Table 2). The black arrows represent the averaged proper motion vectors, defined as in Sect. 2, between E1–E2 and E1–E3 data.
Current usage metrics show cumulative count of Article Views (full-text article views including HTML views, PDF and ePub downloads, according to the available data) and Abstracts Views on Vision4Press platform.
Data correspond to usage on the plateform after 2015. The current usage metrics is available 48-96 hours after online publication and is updated daily on week days.
Initial download of the metrics may take a while.