Fig. 5.
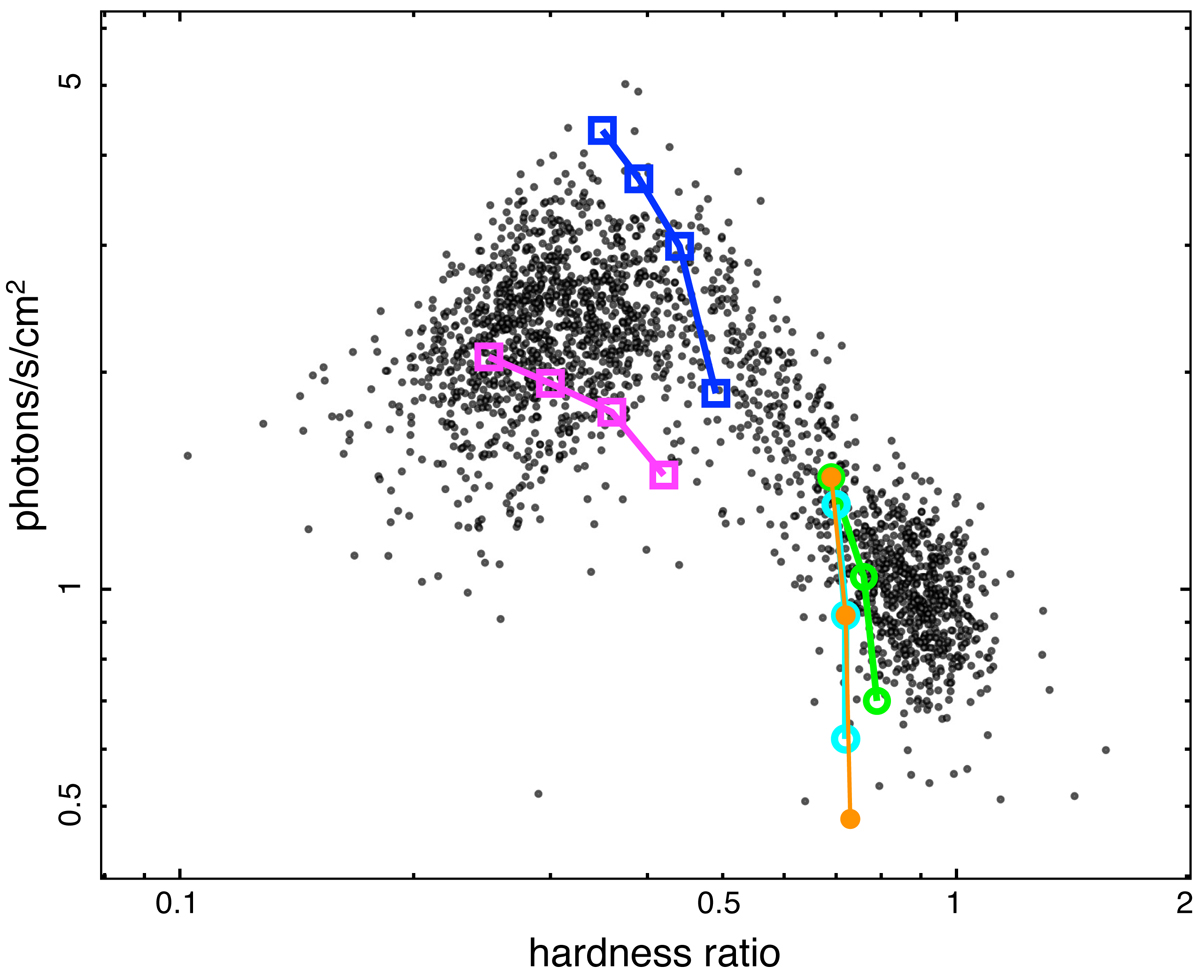
Comparison of computational results with MAXI observations in Fig. 2. The hardness and count rate are computed from spectra emitted from the disk and corona, as determined by the condensation model. Theoretical results for the soft state are shown for mass supply rates Ṁ/ṀEdd = 0.02,0.03,0.04,0.05 (count rates increase), viscosity α = 0.15 (purple dots) and α = 0.2 (blue dots), and albedo fixed at 0.15. Theoretical results for the hard state are shown for different mass accretion rates (Ṁ/ṀEdd = 0.03, 0.035,0.04), fixed α = 0.5, and albedo = 0.5 (orange dots); for different viscosity (α = 0.45, 0.5, 0.55), a fixed accretion rate of 0.035, and albedo = 0.5 (cyan dots); for different albedo (a = 0.5, 0.7, 0.9), fixed viscosity α = 0.5, and an accretion rate of 0.04 (green dots).
Current usage metrics show cumulative count of Article Views (full-text article views including HTML views, PDF and ePub downloads, according to the available data) and Abstracts Views on Vision4Press platform.
Data correspond to usage on the plateform after 2015. The current usage metrics is available 48-96 hours after online publication and is updated daily on week days.
Initial download of the metrics may take a while.