Fig. 2.
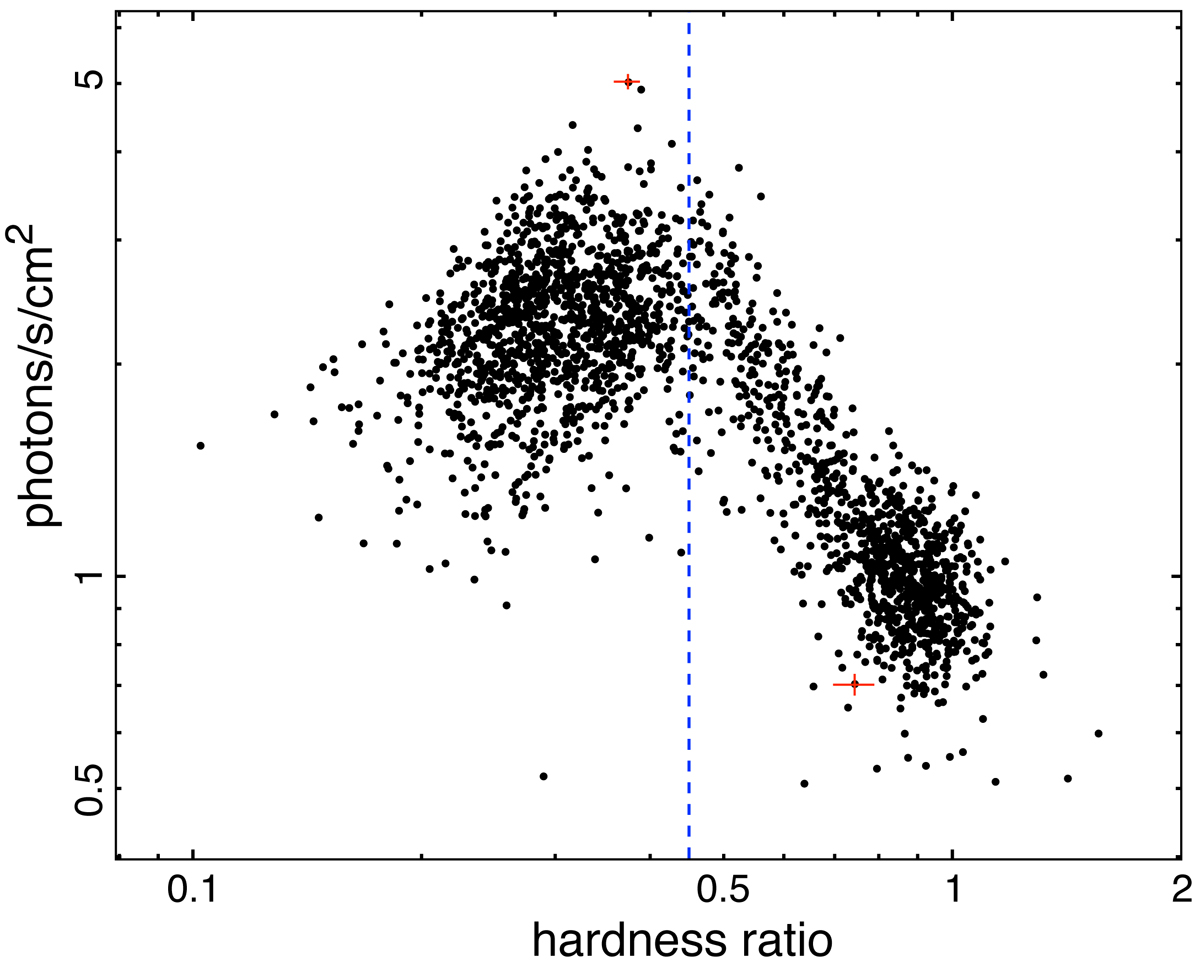
Hardness-intensity diagram for all MAXI observations during the time period from 2009 to 2018 for Cyg X-1. Photon counts in the energy band 2–10 keV are approximated by counts in the band 2–20 keV minus counts in 10–20 keV. The hardness ratio is defined as counts in the energy bands 4–10 keV vs. 2–4 keV. The blue vertical line indicates the threshold of h = 0.45. Two red error bars indicate the errors at higher and lower photon count rates.
Current usage metrics show cumulative count of Article Views (full-text article views including HTML views, PDF and ePub downloads, according to the available data) and Abstracts Views on Vision4Press platform.
Data correspond to usage on the plateform after 2015. The current usage metrics is available 48-96 hours after online publication and is updated daily on week days.
Initial download of the metrics may take a while.