Fig. 2
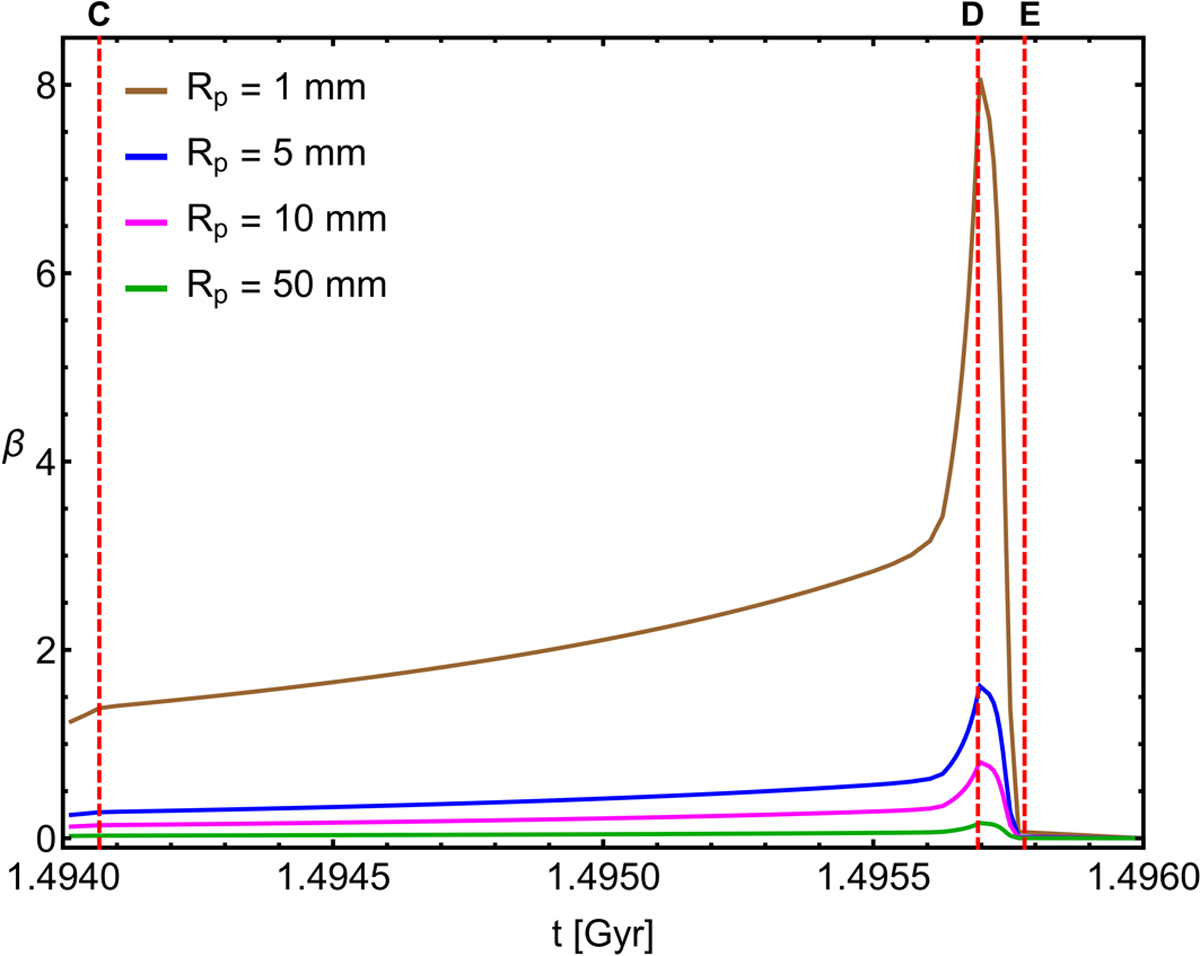
Time-evolution of the radiation pressure factor β for grains of four different radii. The red, vertical, dashed lines are the same as those in Fig. 1. Although not discernable on the plot, the Tip of the AGB does not coincide exactly with the peak of β because at that time the stellar mass is still decreasing. However, the time between both peaks is just about 1600 yr.
Current usage metrics show cumulative count of Article Views (full-text article views including HTML views, PDF and ePub downloads, according to the available data) and Abstracts Views on Vision4Press platform.
Data correspond to usage on the plateform after 2015. The current usage metrics is available 48-96 hours after online publication and is updated daily on week days.
Initial download of the metrics may take a while.