Free Access
Fig. 1
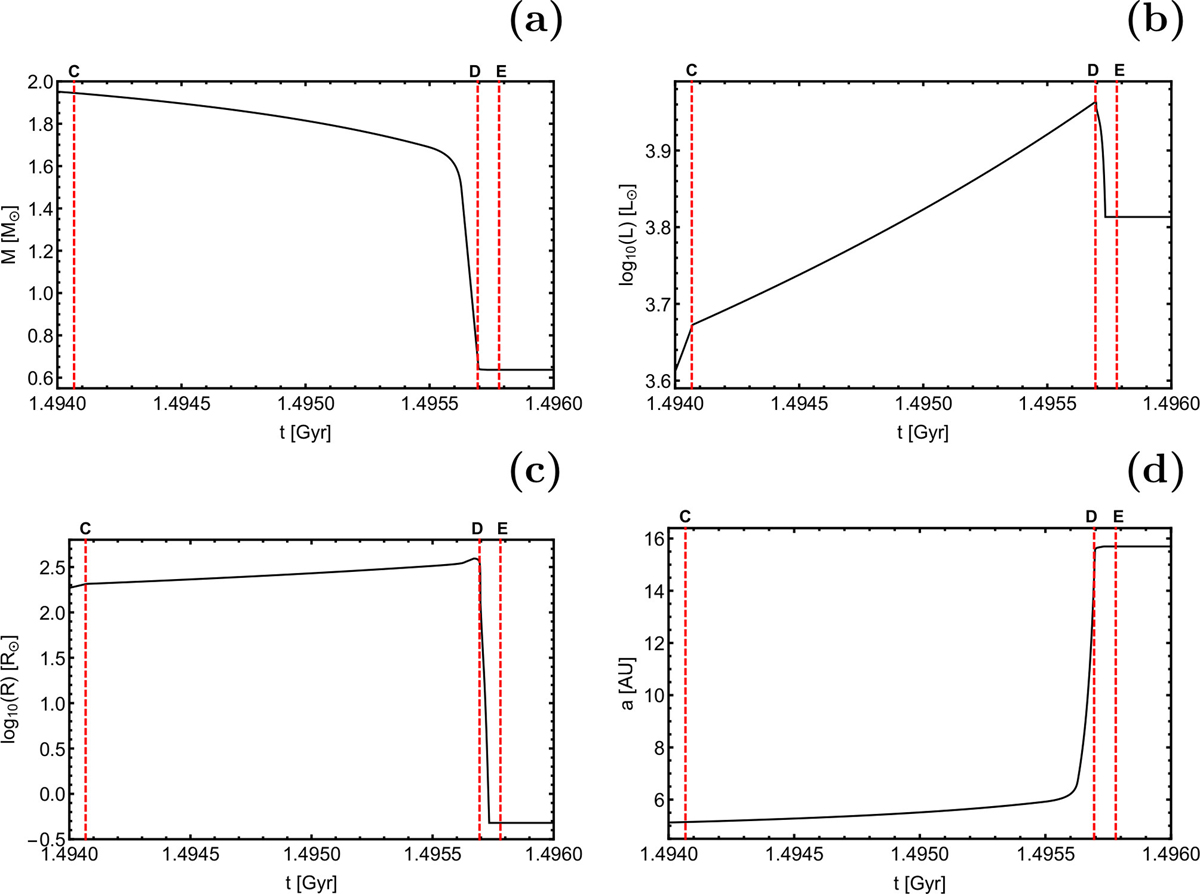
Time-evolution of the mass, luminosity and radius of the star (panels a–c) and the semi-major axis of the planet-star system (panel d). The red, vertical, dashed lines correspond to the critical stages of the stellar evolution, which are (“C”: Start of TPAGB; “D”: Tip of AGB; “E”: Start of WD).
Current usage metrics show cumulative count of Article Views (full-text article views including HTML views, PDF and ePub downloads, according to the available data) and Abstracts Views on Vision4Press platform.
Data correspond to usage on the plateform after 2015. The current usage metrics is available 48-96 hours after online publication and is updated daily on week days.
Initial download of the metrics may take a while.