Table 2
Abundances (relative to H2) of parent molecules other than H2 and CO derived from observations of M, S, and C stars.
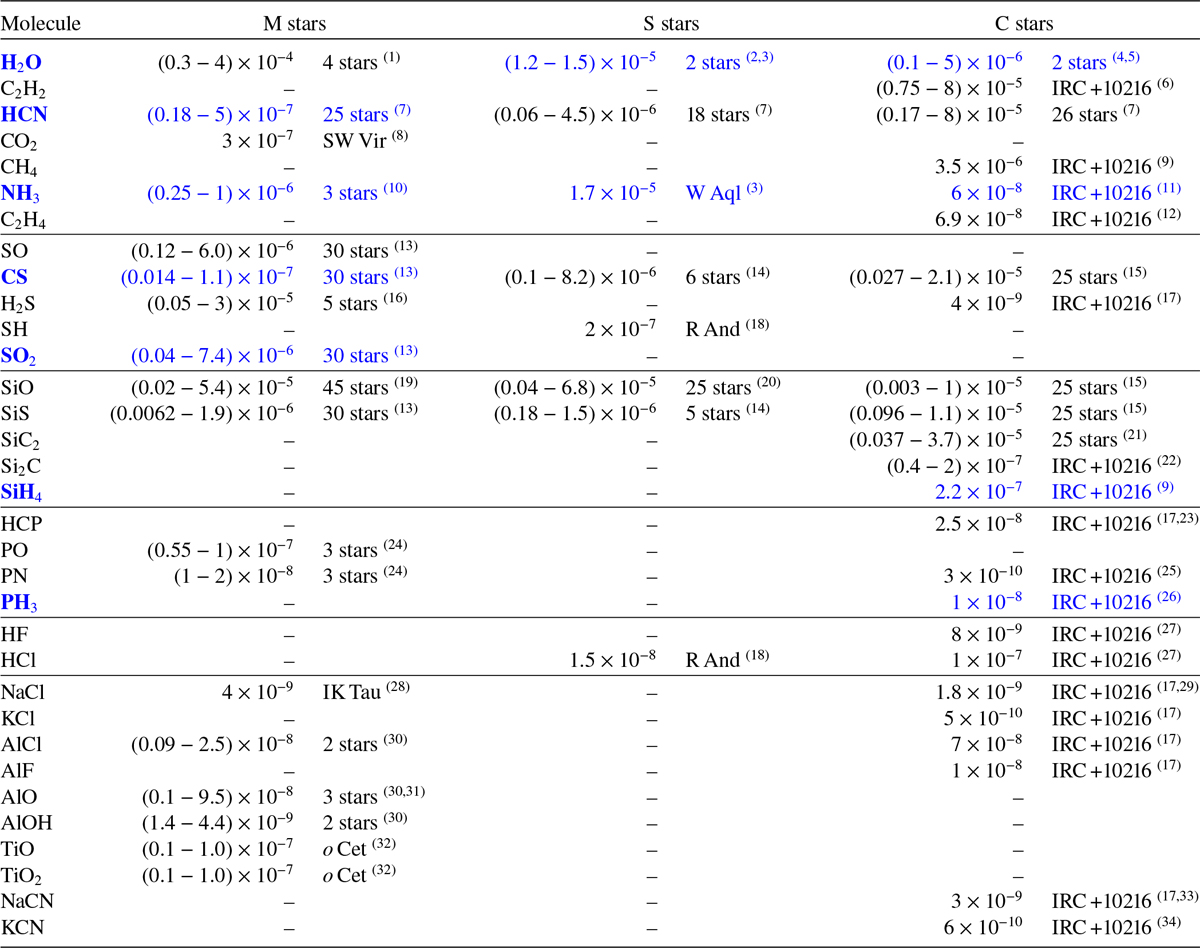
Notes. The cases in which observed abundances are much higher than expected from chemical equilibrium are highlighted in blue.
References. (1) Maercker et al. (2016). (2) Schöier et al. (2011). (3) Danilovich et al. (2014). (4) Decin et al. (2010). (5) Neufeld et al. (2010). (6) Fonfría et al. (2008). (7) Schöier et al. (2013). (8) Tsuji et al. (1997). (9) Keady & Ridgway (1993). (10) Wong et al. (2018). (11) Schmidt et al. (2016). (12) Fonfría et al. (2017). (13) Massalkhi et al. (2020). (14) Danilovich et al. (2018). (15) Massalkhi et al. (2019). (16) Danilovich et al. (2017). (17) Agúndez et al. (2012). (18) Yamamura et al. (2000). (19) González Delgado et al. (2003). (20) Ramstedt et al. (2009), V386 Cep removed. (21) Massalkhi et al. (2018). (22) Cernicharo et al. (2015). (23) Agúndez et al. (2007). (24) Ziurys et al. (2018). (25) Milam et al. (2008). (26) Agúndez et al. (2014b). (27) Agúndez et al. (2011). (28) Milam et al. (2007). (29) Quintana-Lacaci et al. (2016). (30) Decin et al. (2017). (31) Kamiński et al. (2016). (32) Kamiński et al. (2017). (33) Quintana-Lacaci et al. (2017). (34) Pulliam et al. (2010).
Current usage metrics show cumulative count of Article Views (full-text article views including HTML views, PDF and ePub downloads, according to the available data) and Abstracts Views on Vision4Press platform.
Data correspond to usage on the plateform after 2015. The current usage metrics is available 48-96 hours after online publication and is updated daily on week days.
Initial download of the metrics may take a while.