Fig. 2
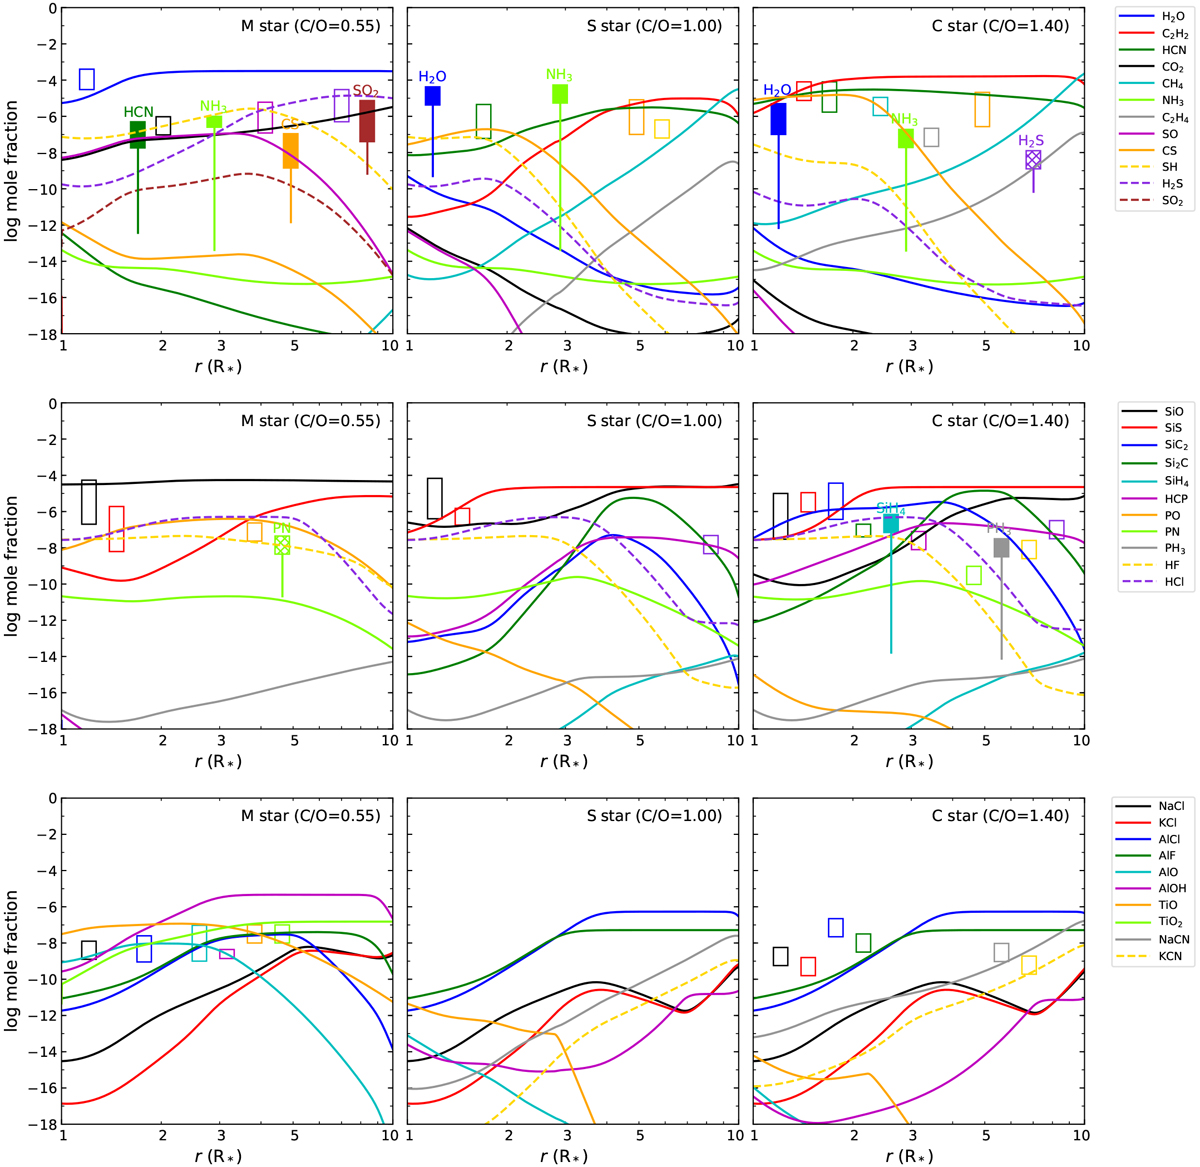
Calculated chemical equilibrium abundances of parent molecules in M-, S-, and C-type AGB atmospheres are shown as a function of radius and are compared with abundances derived from observations. Chemical equilibrium calculations include only gaseous species. Observed abundances are indicated by rectangles, whose vertical extent corresponds to the range of observed abundances given in Table 2. Rectangles are located at different radii to facilitate visualization. Empty rectangles correspond to cases in which observed abundances agree with any of the abundances calculated by chemical equilibrium in the 1–10 R* range (usually the maximum abundance). Filled rectangles are used to indicate cases with a severe disagreement (by several orders of magnitude) between observed and calculated abundances, while we use hatched rectangles to indicate a significantdisagreement (by more than one order of magnitude). The level of disagreement between the observed and maximum calculated abundance is indicated by a vertical line.
Current usage metrics show cumulative count of Article Views (full-text article views including HTML views, PDF and ePub downloads, according to the available data) and Abstracts Views on Vision4Press platform.
Data correspond to usage on the plateform after 2015. The current usage metrics is available 48-96 hours after online publication and is updated daily on week days.
Initial download of the metrics may take a while.