Fig. 1
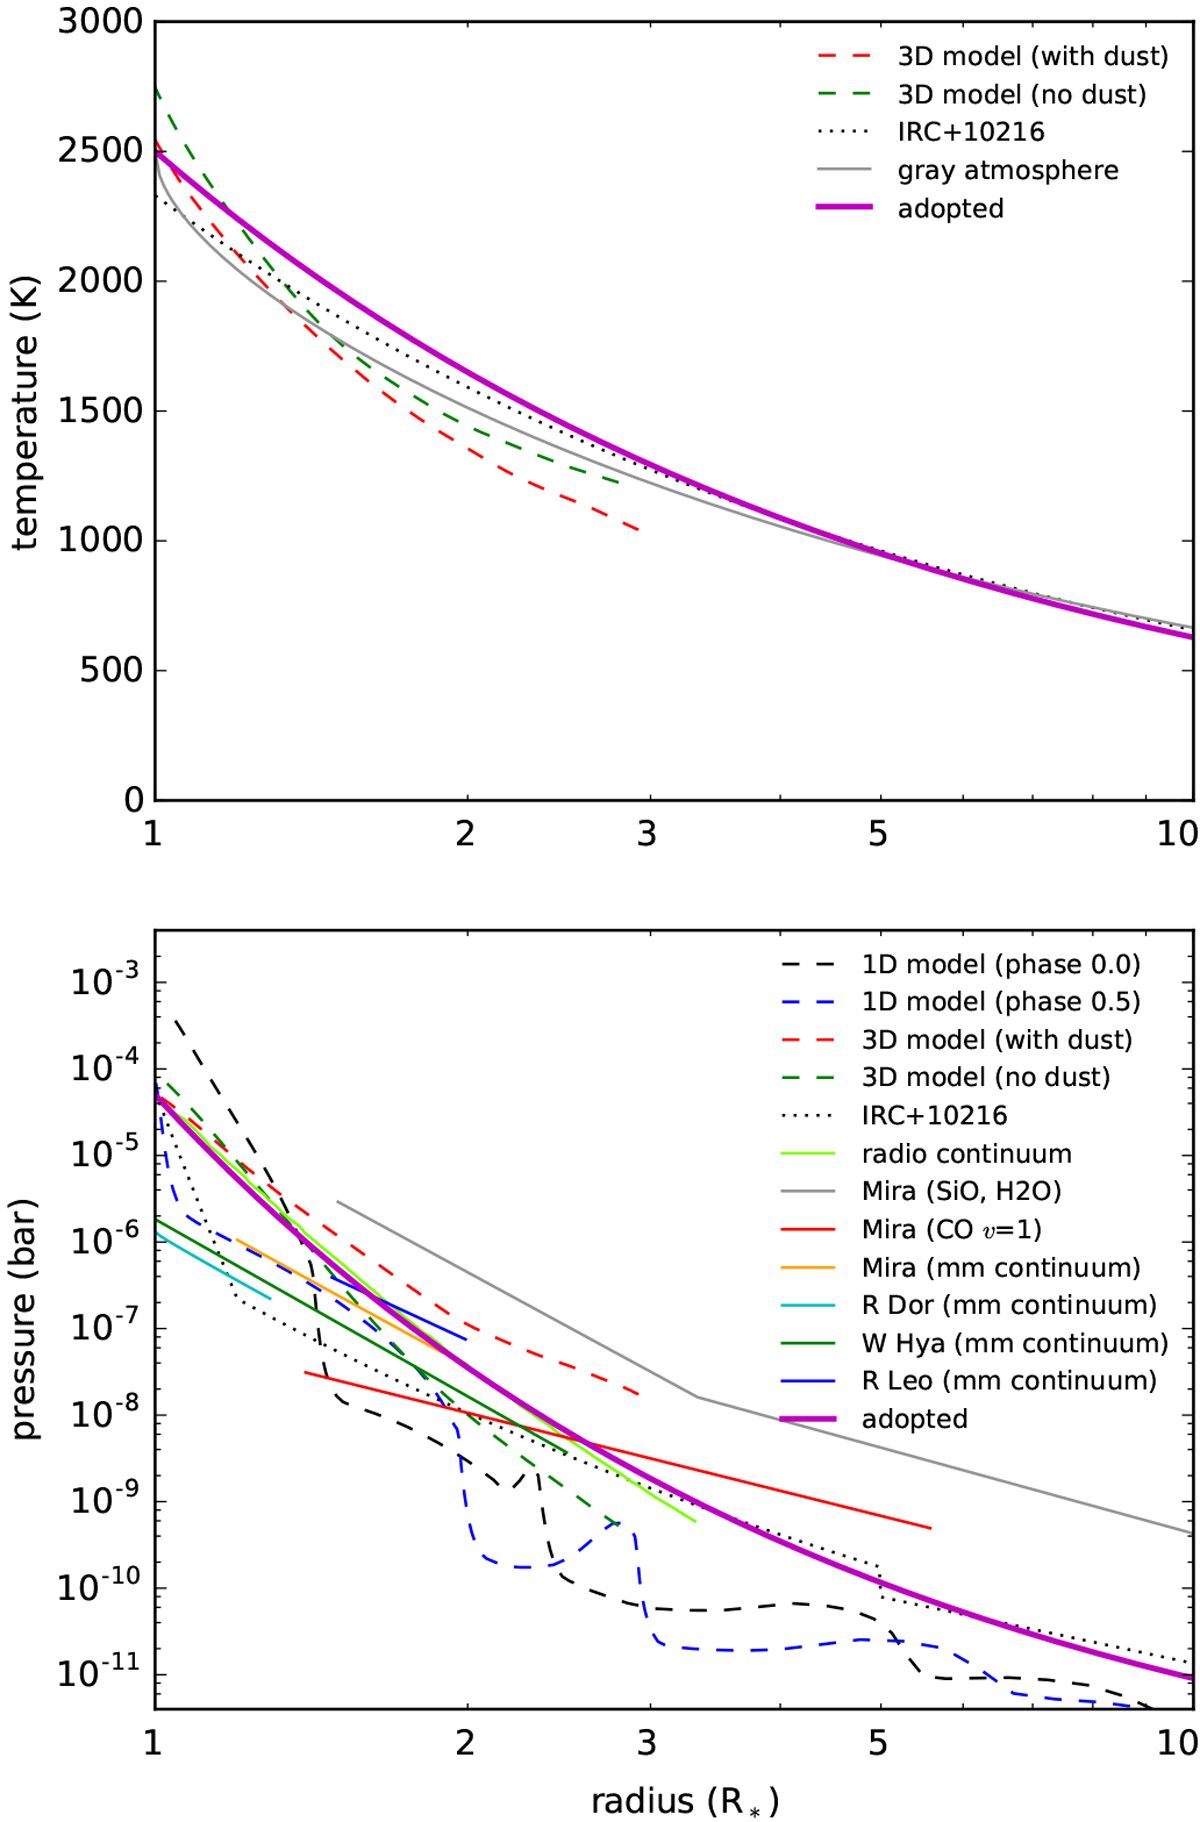
Radial temperature (top panel) and pressure (bottom panel) profiles in the extended atmosphere of an AGB star. The black and blue dashed curves correspond to a 1D model of an AGB atmosphere at phases 0.0 and 0.5 (see Fig. 1 of Bladh et al. 2019). The green and blue dashed curves show the profiles resulting from a 3D model of an AGB atmosphere with and without radiation pressure on dust (models st28gm06n06 and st28gm06n26 from Freytag et al. 2017, where profiles are averaged over spherical shells and time). The black dotted line shows the empirical profile derived for the carbon star IRC +10216 (Agúndez et al. 2012). In the bottom panel we also show as thin solid lines several radial pressure profiles derived from high angular resolution observations of the radio continuum of several AGB stars (Reid & Menten 1997), of Mira from ALMA observations of SiO and H2O (Wong et al. 2016) and of CO v = 1 (Khouri et al. 2018), and of Mira, R Leo, W Hya, and R Dor from ALMA observations of the (sub)millimeter continuum (Vlemmings et al. 2019). The radial temperature and pressure profiles adopted in this study as representative of an AGB atmosphere are shown as thick magenta curves.
Current usage metrics show cumulative count of Article Views (full-text article views including HTML views, PDF and ePub downloads, according to the available data) and Abstracts Views on Vision4Press platform.
Data correspond to usage on the plateform after 2015. The current usage metrics is available 48-96 hours after online publication and is updated daily on week days.
Initial download of the metrics may take a while.