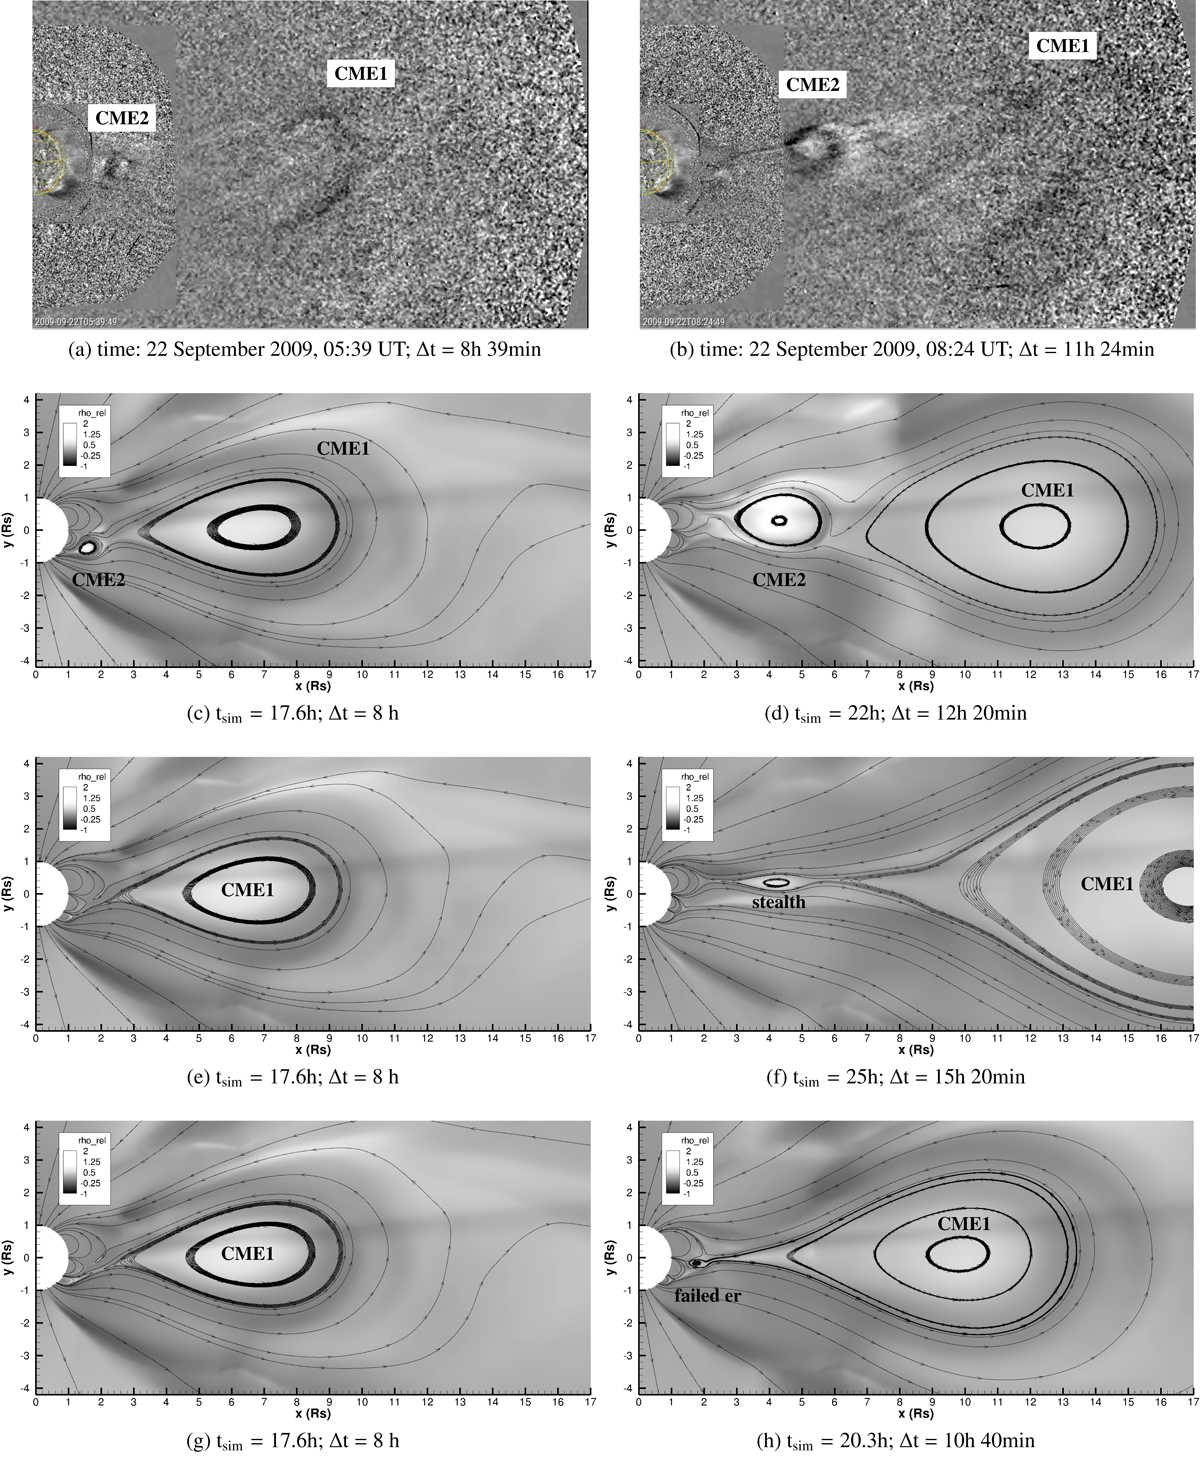
Fig. 8.

Download original image
First column: snapshots of observations and MPI-AMRVAC simulations taken when CME1 front is located at 10 R⊙. Second column: snapshots of observations and simulations taken when CME2 front is located at 6 R⊙ (except (h)). Panels a and b: running difference images taken from EUVI, COR1, and COR2 instruments on board STEREO-B and visualised in JHelioviewer software. Snapshots of the simulated relative density and selected magnetic field lines: panels c and d indicate the double eruption scenario, panels e and f show the stealth eruption scenario, and panels g and h indicate the failed eruption scenario. The parameter Δt represents the time interval from the eruption of CME1, chosen as 21 September 2009 21:00 UT, or 9.6 h simulation time after the start of shearing motions, when the centre of the flux rope crosses 1.5 R⊙ and enters COR1-B field of view.
Current usage metrics show cumulative count of Article Views (full-text article views including HTML views, PDF and ePub downloads, according to the available data) and Abstracts Views on Vision4Press platform.
Data correspond to usage on the plateform after 2015. The current usage metrics is available 48-96 hours after online publication and is updated daily on week days.
Initial download of the metrics may take a while.


