Fig. 3.
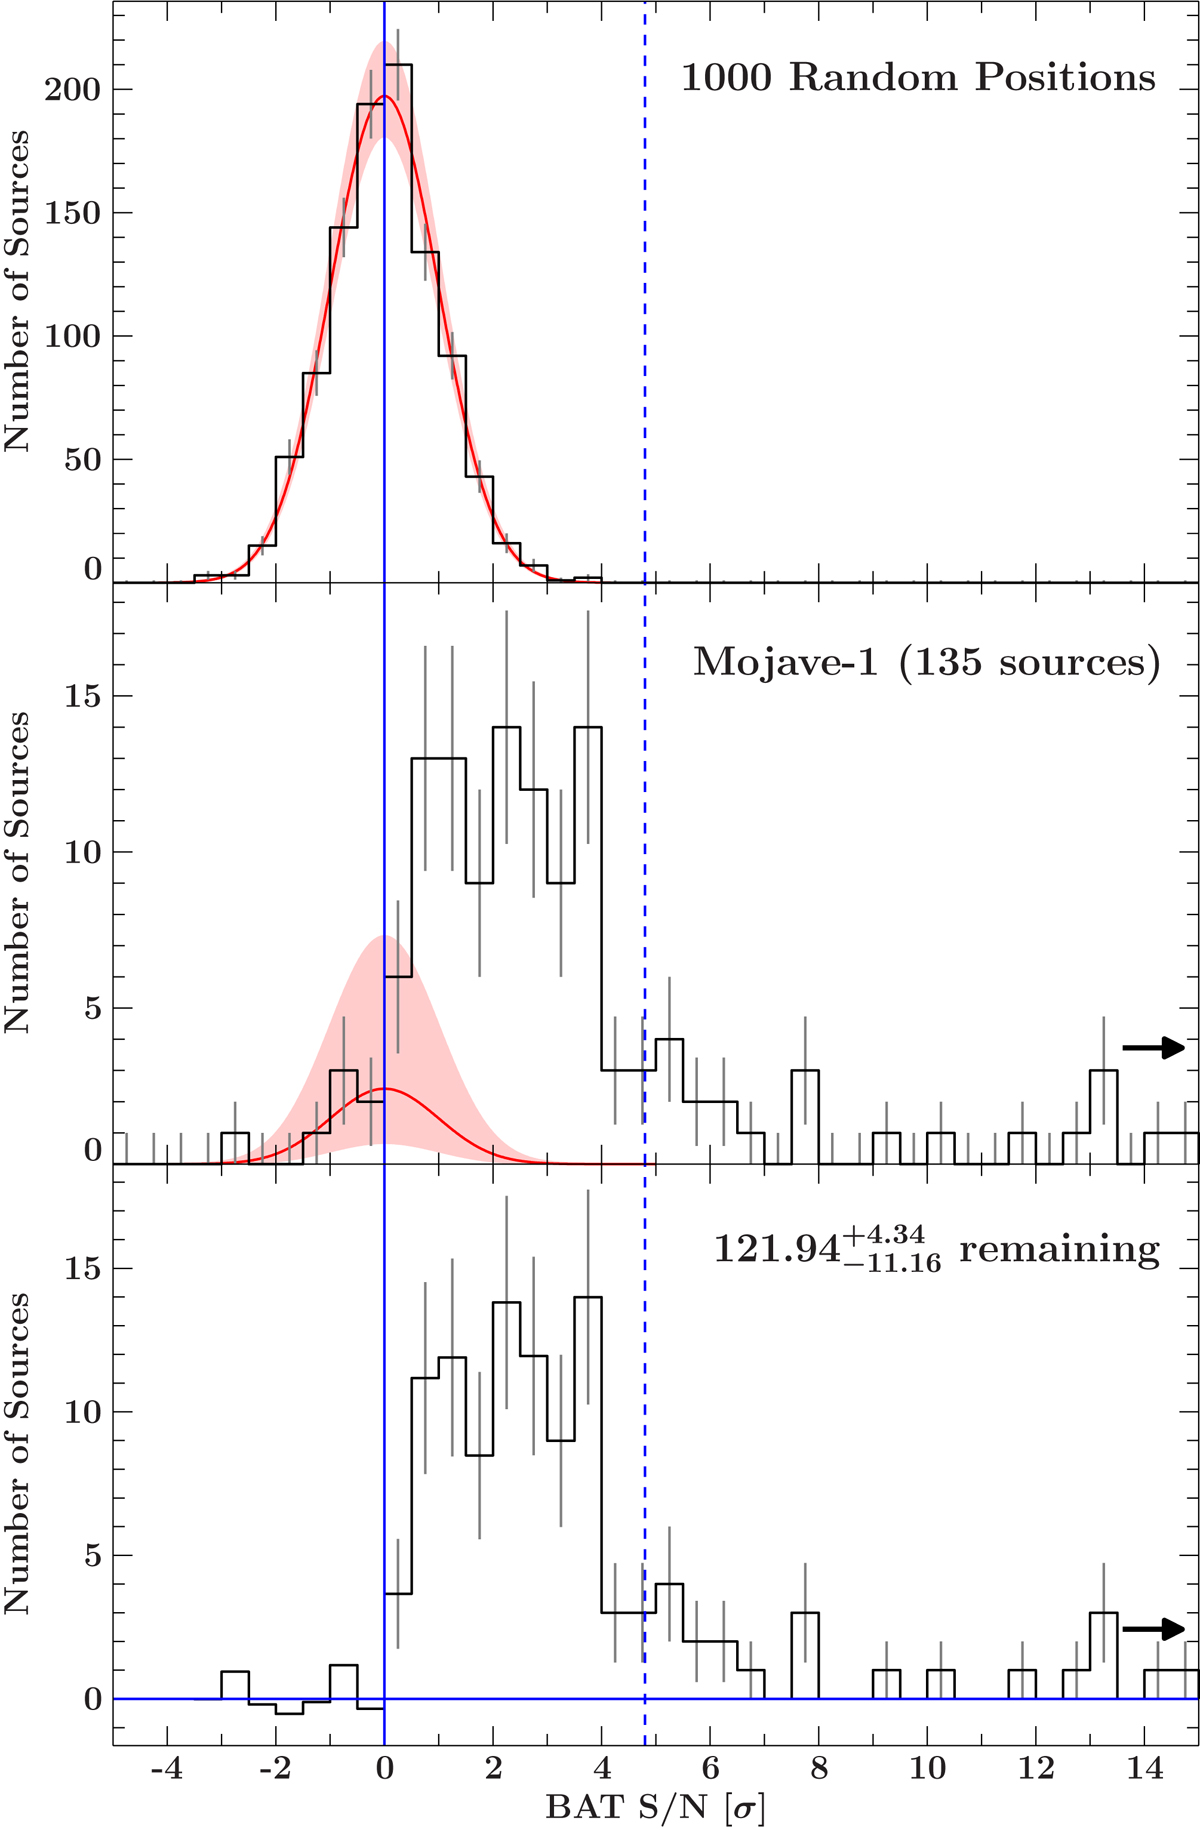
Top panel: distribution of Swift/BAT S/N values of 1000 random blank sky positions. The red line indicates a Gaussian fit with center of 0σ and width 1σ. The red shaded region indicates 3σ uncertainty ranges for the norm of the fitted function. Middle panel: distribution of Swift/BAT S/N values of the MOJAVE-1 sample. The red line indicates a Gaussian fit with center of 0σ and width 1σ to the distribution with values smaller than 0σ. The red shaded region indicates 3σ error ranges. The 4.8σ threshold of the 105-month BAT survey is shown by the dashed line. Bottom panel: resulting histogram after subtracting the MOJAVE-1 S/N distribution by the distribution described by the Gaussian fit. Arrows indicate the cutoff at 15σ (for better readability).
Current usage metrics show cumulative count of Article Views (full-text article views including HTML views, PDF and ePub downloads, according to the available data) and Abstracts Views on Vision4Press platform.
Data correspond to usage on the plateform after 2015. The current usage metrics is available 48-96 hours after online publication and is updated daily on week days.
Initial download of the metrics may take a while.