Fig. 10.
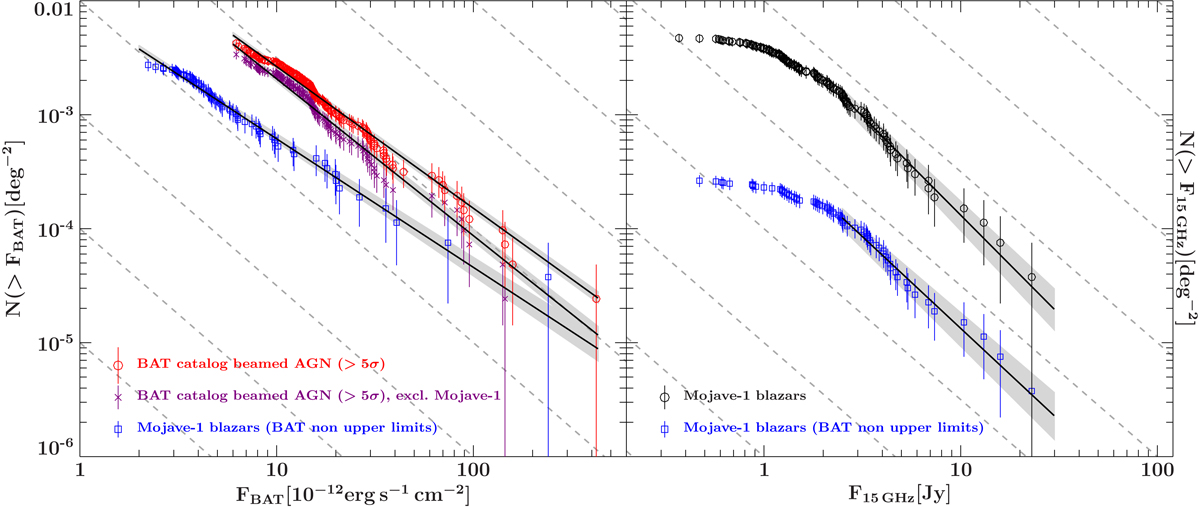
Left: cumulative log N–log S distribution of the MOJAVE-1 sample excluding radio galaxies, omitting all upper limits (flux for 20–100 keV, blue squares) and log N–log S for the beamed AGN sub-sample of the BAT 105-month source catalog (flux for 14 keV–195 keV, red circles) and the same sub-sample excluding all MOJAVE-1 sources (14 keV–195 keV, purple x). Right: log N–log S for 15 GHz flux density VLBI measurements from Lister et al. (2015) of all blazars in the MOJAVE-1 sample (black circles) and MOJAVE-1 blazars from left graph (blue squares, norm with a factor of 0.1 for better readability). The black lines represent power-law fits, the gray area shows the corresponding error range. The radio data have been fit for all fluxes higher than 2.5 Jy. The dashed lines indicate a slope of −1.5.
Current usage metrics show cumulative count of Article Views (full-text article views including HTML views, PDF and ePub downloads, according to the available data) and Abstracts Views on Vision4Press platform.
Data correspond to usage on the plateform after 2015. The current usage metrics is available 48-96 hours after online publication and is updated daily on week days.
Initial download of the metrics may take a while.