Fig. 7.
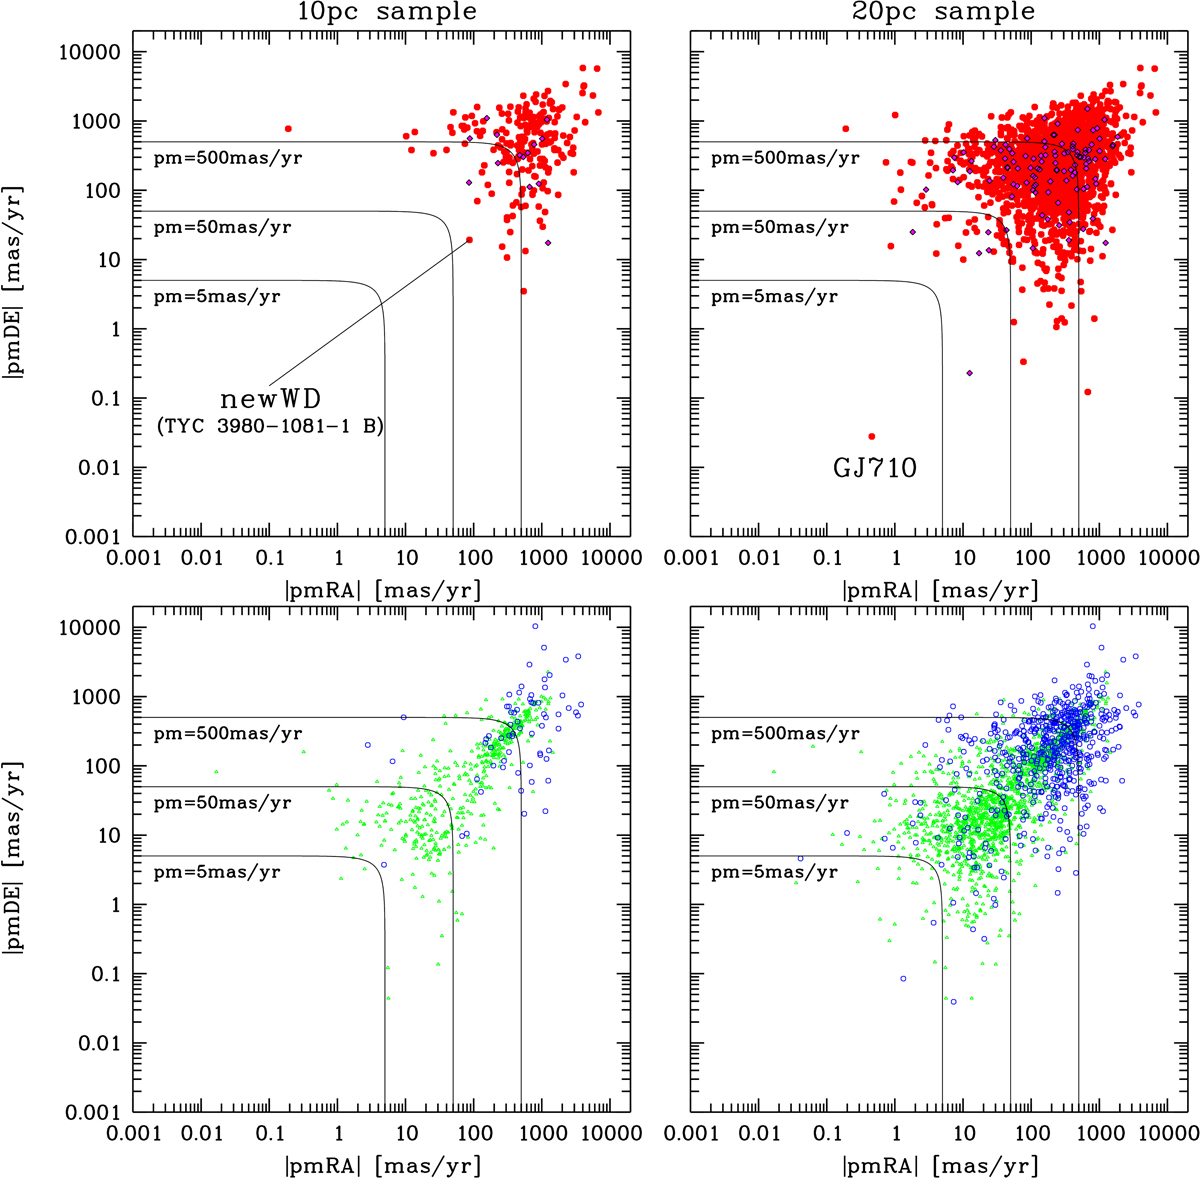
Absolute proper motion components |pmRA| and |pmDE| of stars in the Gaia DR2 10 pc (left panels) and 20 pc samples (right panels) are plotted in logarithmic scale. Total proper motions of 5 mas yr−1, 50 mas yr−1, and 500 mas yr−1 are indicated by solid lines. The symbols for the subsamples A and B (top row) and C and D (bottom row) are the same as in Fig. 3. Two well-measured nearby stars with the smallest proper motions are marked in the top row.
Current usage metrics show cumulative count of Article Views (full-text article views including HTML views, PDF and ePub downloads, according to the available data) and Abstracts Views on Vision4Press platform.
Data correspond to usage on the plateform after 2015. The current usage metrics is available 48-96 hours after online publication and is updated daily on week days.
Initial download of the metrics may take a while.