Fig. 5.
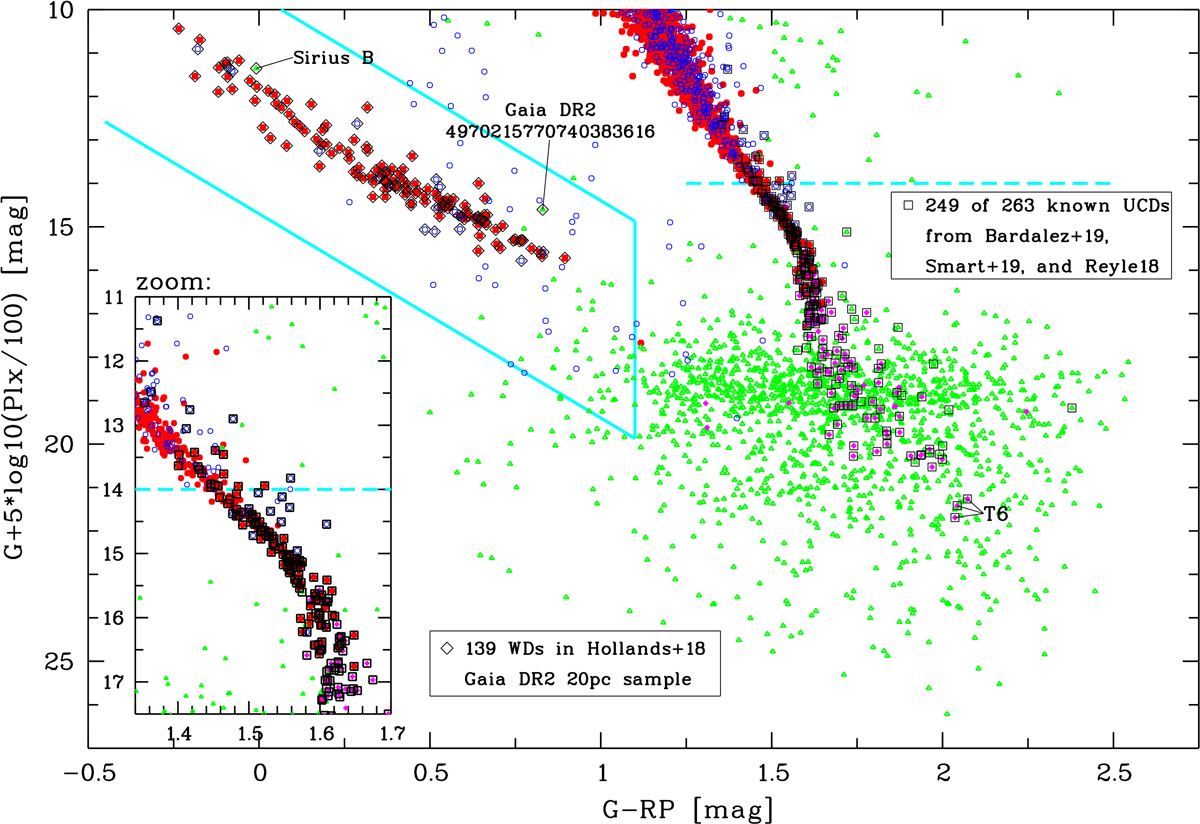
Faint part of the CMD, with a zoom into the MS region around our UCD limit (dashed line), of the full Gaia DR2 20 pc sample with known WDs from Hollands et al. (2018) overplotted as open lozenges and known UCDs from Bardalez Gagliuffi et al. (2019), Smart et al. (2019), and Reylé (2018) overplotted as open squares. The other coloured symbols and lines are the same as in Fig. 3 Two WDs with problematic astrometry and photometry and the three known UCDs of the latest type (T6) are marked.
Current usage metrics show cumulative count of Article Views (full-text article views including HTML views, PDF and ePub downloads, according to the available data) and Abstracts Views on Vision4Press platform.
Data correspond to usage on the plateform after 2015. The current usage metrics is available 48-96 hours after online publication and is updated daily on week days.
Initial download of the metrics may take a while.