Fig. 4.
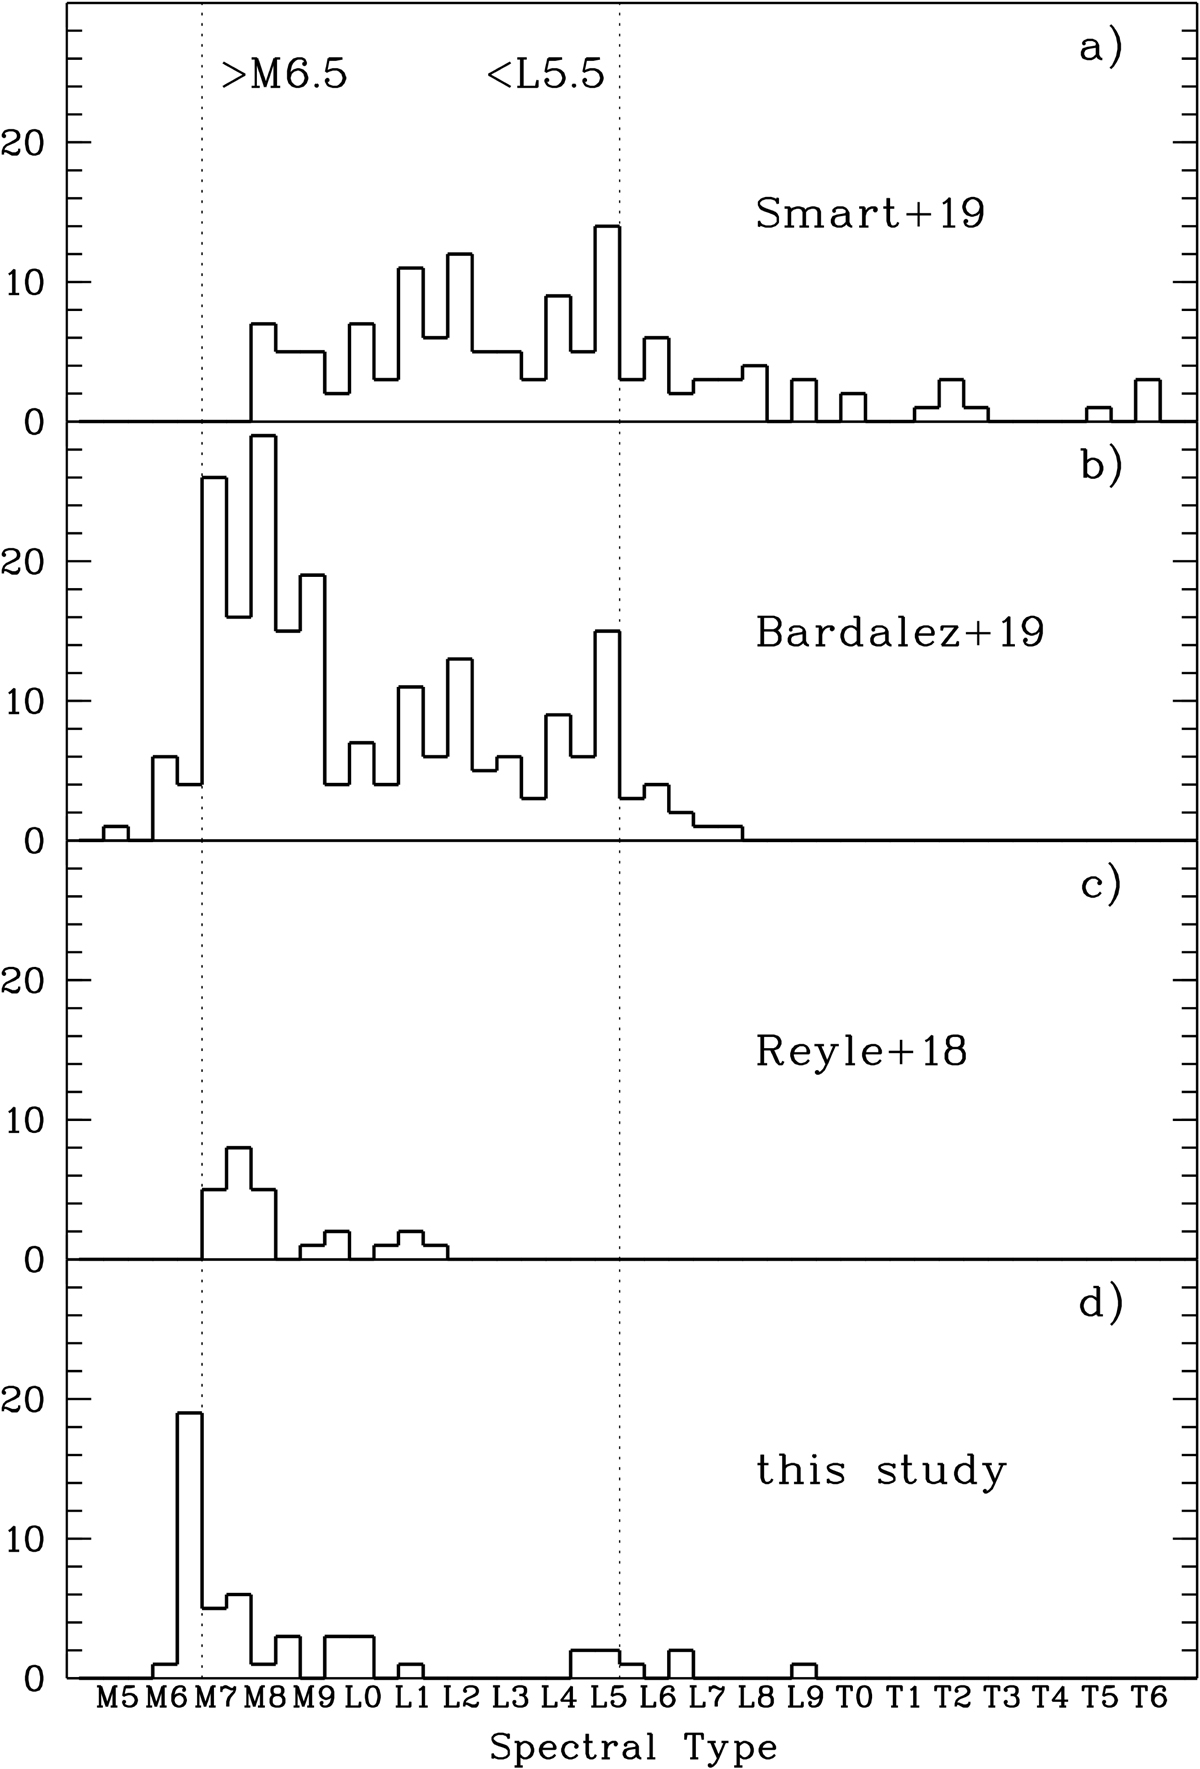
Distribution of spectral types in the Gaia DR2 20 pc subsamples of known spectroscopically classified UCDs from Smart et al. (2019) (panel a) and Bardalez Gagliuffi et al. (2019) (panel b). Panels c and d: distributions for the UCD candidates with photometrically estimated spectral types in Reylé (2018) and this study, respectively. The dotted lines mark the boundaries of the volume-limited spectroscopic sample of Bardalez Gagliuffi et al. (2019) between M6.5 and M7 (also used as the classical UCD dividing line) and L5 and L5.5 dwarfs.
Current usage metrics show cumulative count of Article Views (full-text article views including HTML views, PDF and ePub downloads, according to the available data) and Abstracts Views on Vision4Press platform.
Data correspond to usage on the plateform after 2015. The current usage metrics is available 48-96 hours after online publication and is updated daily on week days.
Initial download of the metrics may take a while.