Fig. 3.
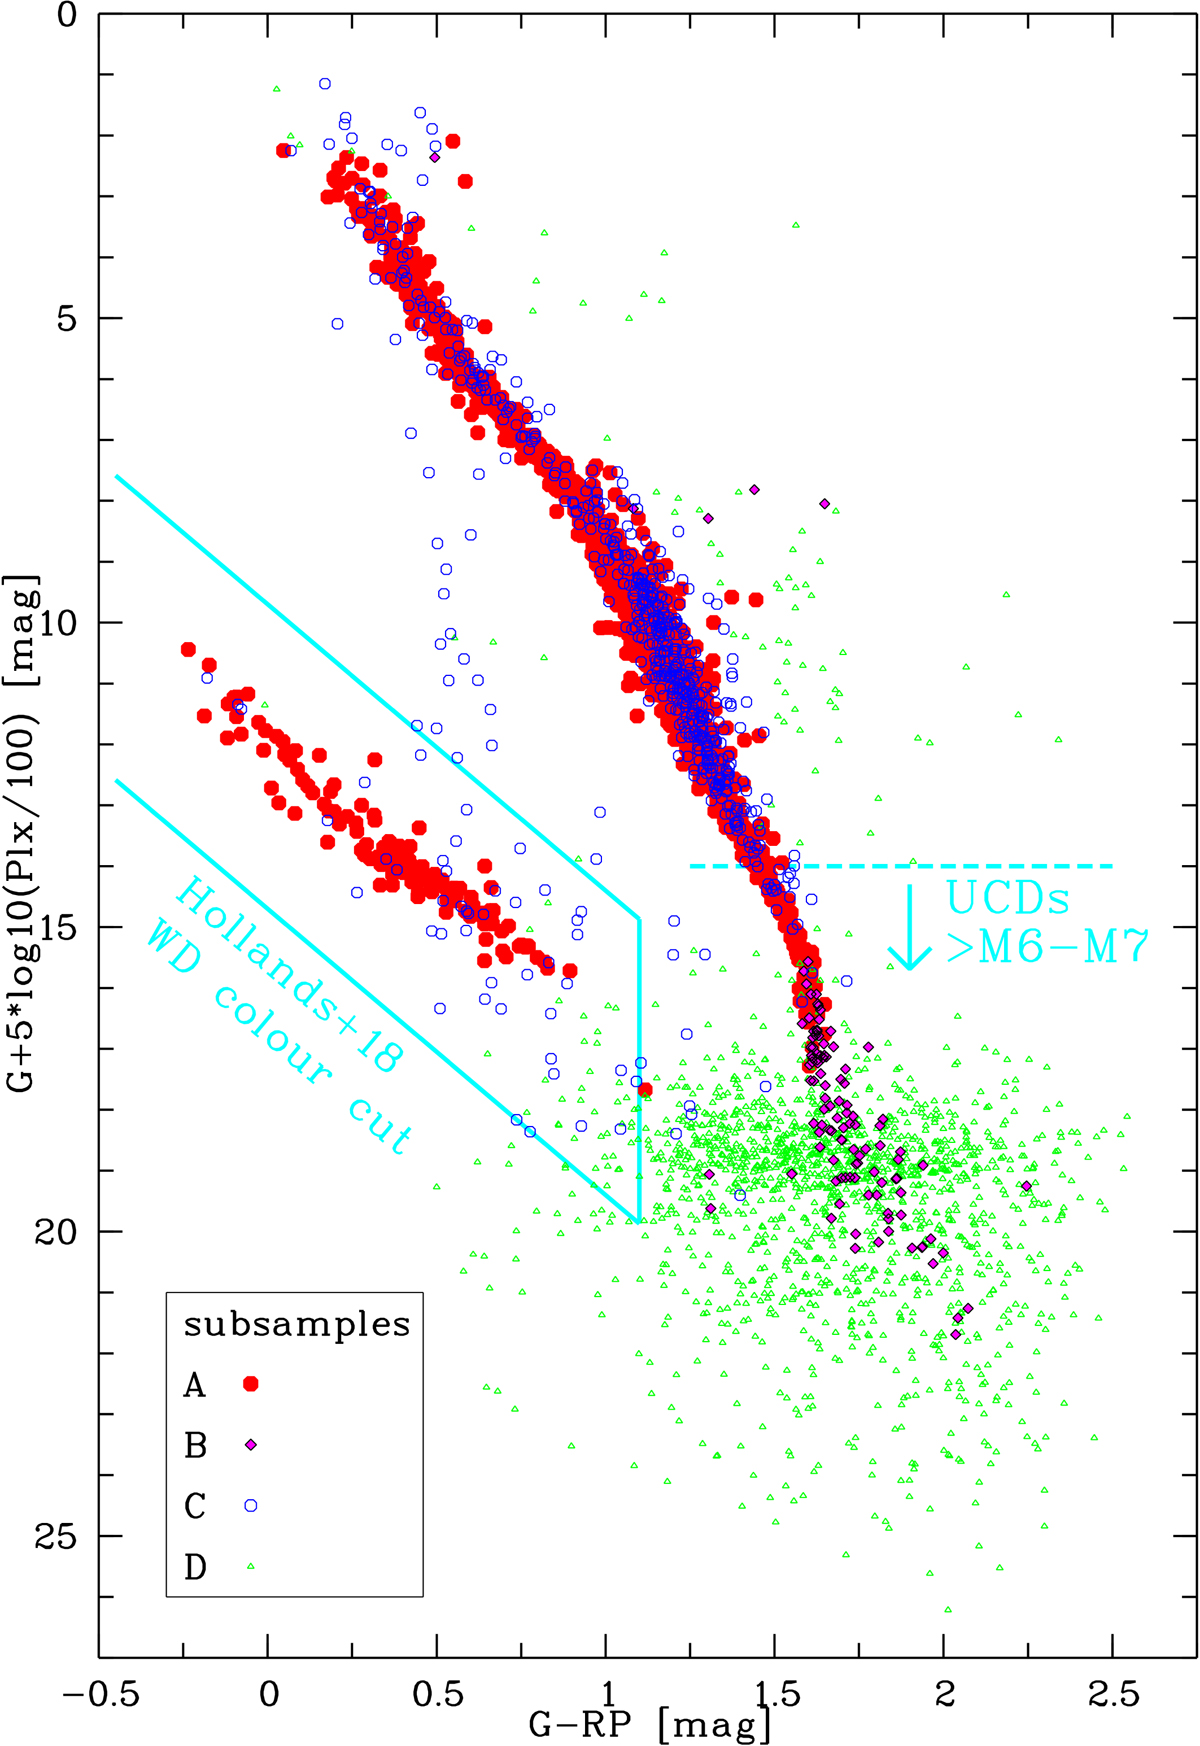
CMD of the full Gaia DR2 20 pc sample. Subsamples A−D defined in Sect. 2.1 are shown with the same colours (red, magenta, blue, and green) as in Fig. 1. The objects with good astrometry (subsamples A and B) are plotted as filled (large and small) symbols, and those with poor astrometry (subsamples C and D) as open (large and small) symbols. Here and in Fig. 7, the filled magenta symbols are overplotted with open black lozenges for better visibility. The colour cuts applied for WDs by Hollands et al. (2018) and the absolute magnitude limit of MG > 14 mag used in this study to select UCDs of spectral types > M6−M7 are drawn in the background as thick solid and dashed cyan lines, respectively.
Current usage metrics show cumulative count of Article Views (full-text article views including HTML views, PDF and ePub downloads, according to the available data) and Abstracts Views on Vision4Press platform.
Data correspond to usage on the plateform after 2015. The current usage metrics is available 48-96 hours after online publication and is updated daily on week days.
Initial download of the metrics may take a while.