Fig. 8
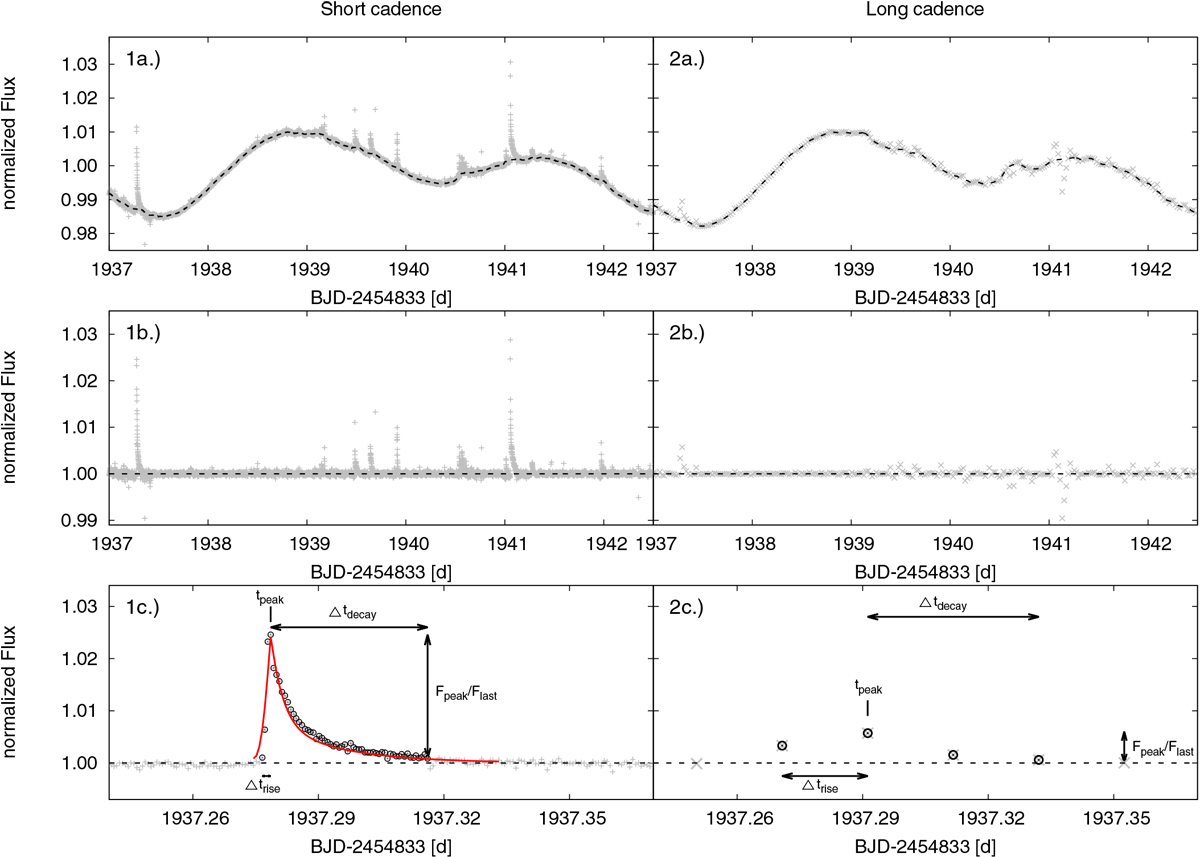
Example for our flare detection and validation procedure. Left and right plots: short- and long-cadence data, respectively. Top: observed and smoothed original (black dashed) LC. Middle: flattened LC (without rotational signal). Bottom: zoom on the first flare candidate from the panels above. All relevant parameters for the flare validation are also shown: tpeak is the time of the flare maximum, Δtrise is the duration of the rise phase, Δtdecay is the duration of the decay phase, Fpeak∕Flast is the flux ratio between the flare maximum and the last flare point (for long-cadence data, Flast is defined as the flux of the first point after the flare). The red solid line is the best-fitting flare template following Davenport et al. (2014).
Current usage metrics show cumulative count of Article Views (full-text article views including HTML views, PDF and ePub downloads, according to the available data) and Abstracts Views on Vision4Press platform.
Data correspond to usage on the plateform after 2015. The current usage metrics is available 48-96 hours after online publication and is updated daily on week days.
Initial download of the metrics may take a while.