Fig. 22
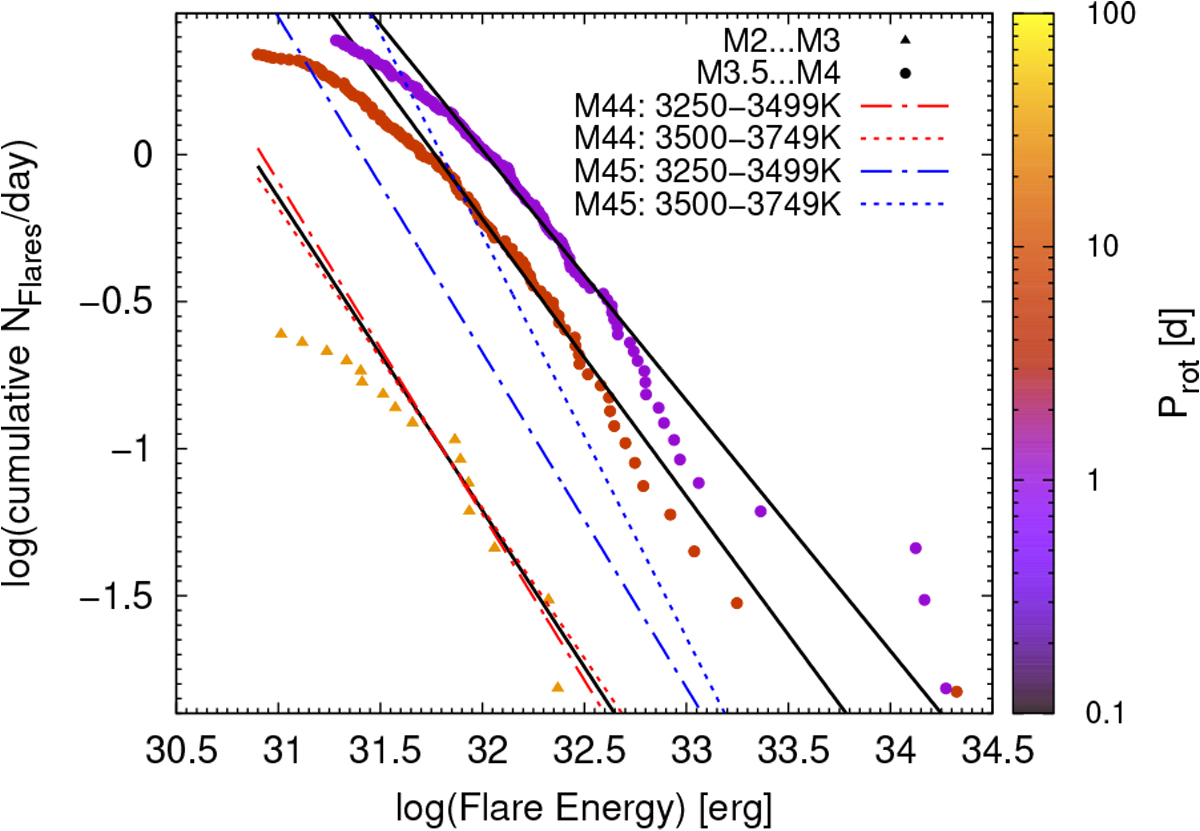
Cumulative flare frequency diagram for three selected targets from our sample with different rotation periods. The black solid lines give the power-law fit including all flares above a given energy detection threshold (see text in Sect. 7.4). We also show the power-law fits of Ilin et al. (2019, from their Table 4) for Praesepe (M 44, 630 Myr, red) and the Pleiades (M 45, 125 Myr, blue) in the same temperature range of our selected targets.
Current usage metrics show cumulative count of Article Views (full-text article views including HTML views, PDF and ePub downloads, according to the available data) and Abstracts Views on Vision4Press platform.
Data correspond to usage on the plateform after 2015. The current usage metrics is available 48-96 hours after online publication and is updated daily on week days.
Initial download of the metrics may take a while.