Free Access
Fig. 21
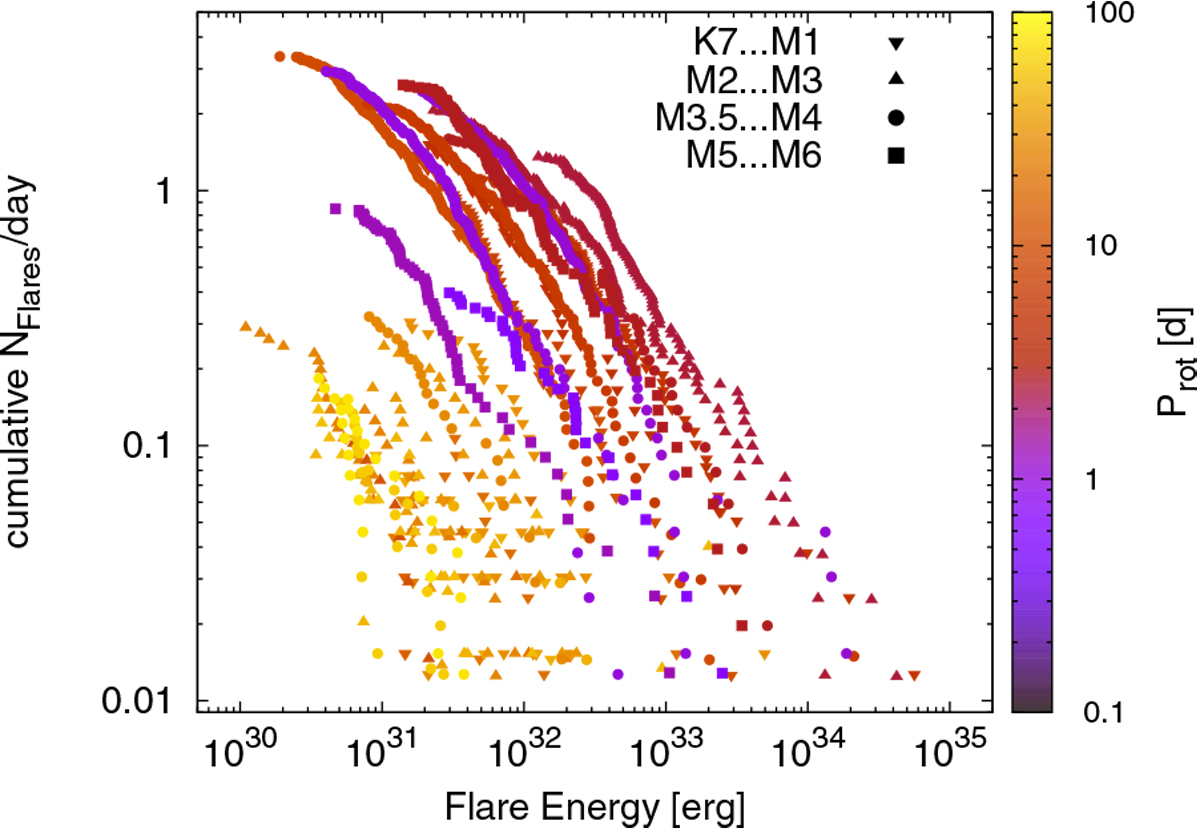
Cumulative flare energy frequency distribution for all targets with measurable rotation periods that show flares in short-cadence LCs. The rotation period of the stars is color-coded. In Fig. C.1 we show a separate plot for the FFDs of each SpT group.
Current usage metrics show cumulative count of Article Views (full-text article views including HTML views, PDF and ePub downloads, according to the available data) and Abstracts Views on Vision4Press platform.
Data correspond to usage on the plateform after 2015. The current usage metrics is available 48-96 hours after online publication and is updated daily on week days.
Initial download of the metrics may take a while.