Fig. 19
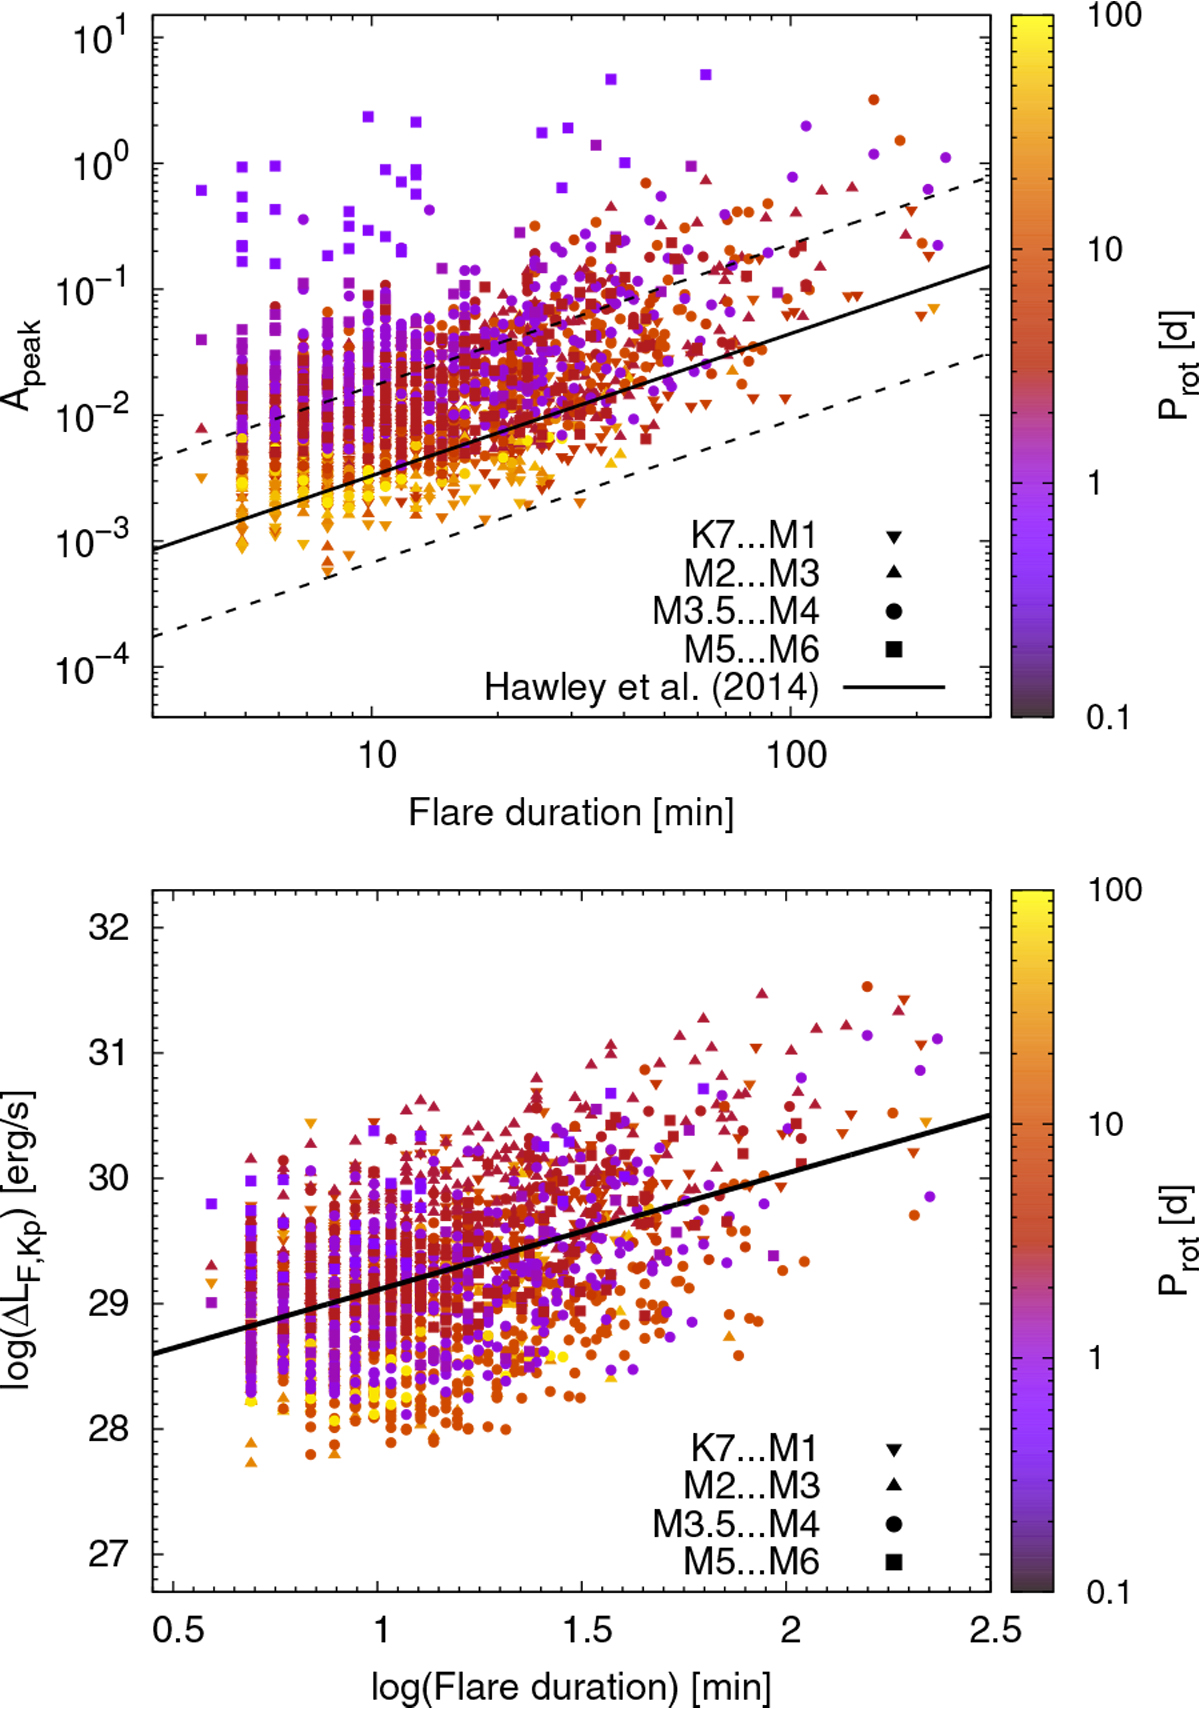
Top: relation between flare duration and relative amplitude for all validated short-cadence flares on stars with measured rotation periods. The solid black line represents the duration–amplitude relation from Hawley et al. (2014), which we extracted from their Fig. 10. The dashed lines give the lower and upper envelope of their relation. Bottom: relation between flare duration and absolute peak flare amplitude. Our linear relation (Eq. (4)) is given as the black solid line.
Current usage metrics show cumulative count of Article Views (full-text article views including HTML views, PDF and ePub downloads, according to the available data) and Abstracts Views on Vision4Press platform.
Data correspond to usage on the plateform after 2015. The current usage metrics is available 48-96 hours after online publication and is updated daily on week days.
Initial download of the metrics may take a while.