Fig. 10
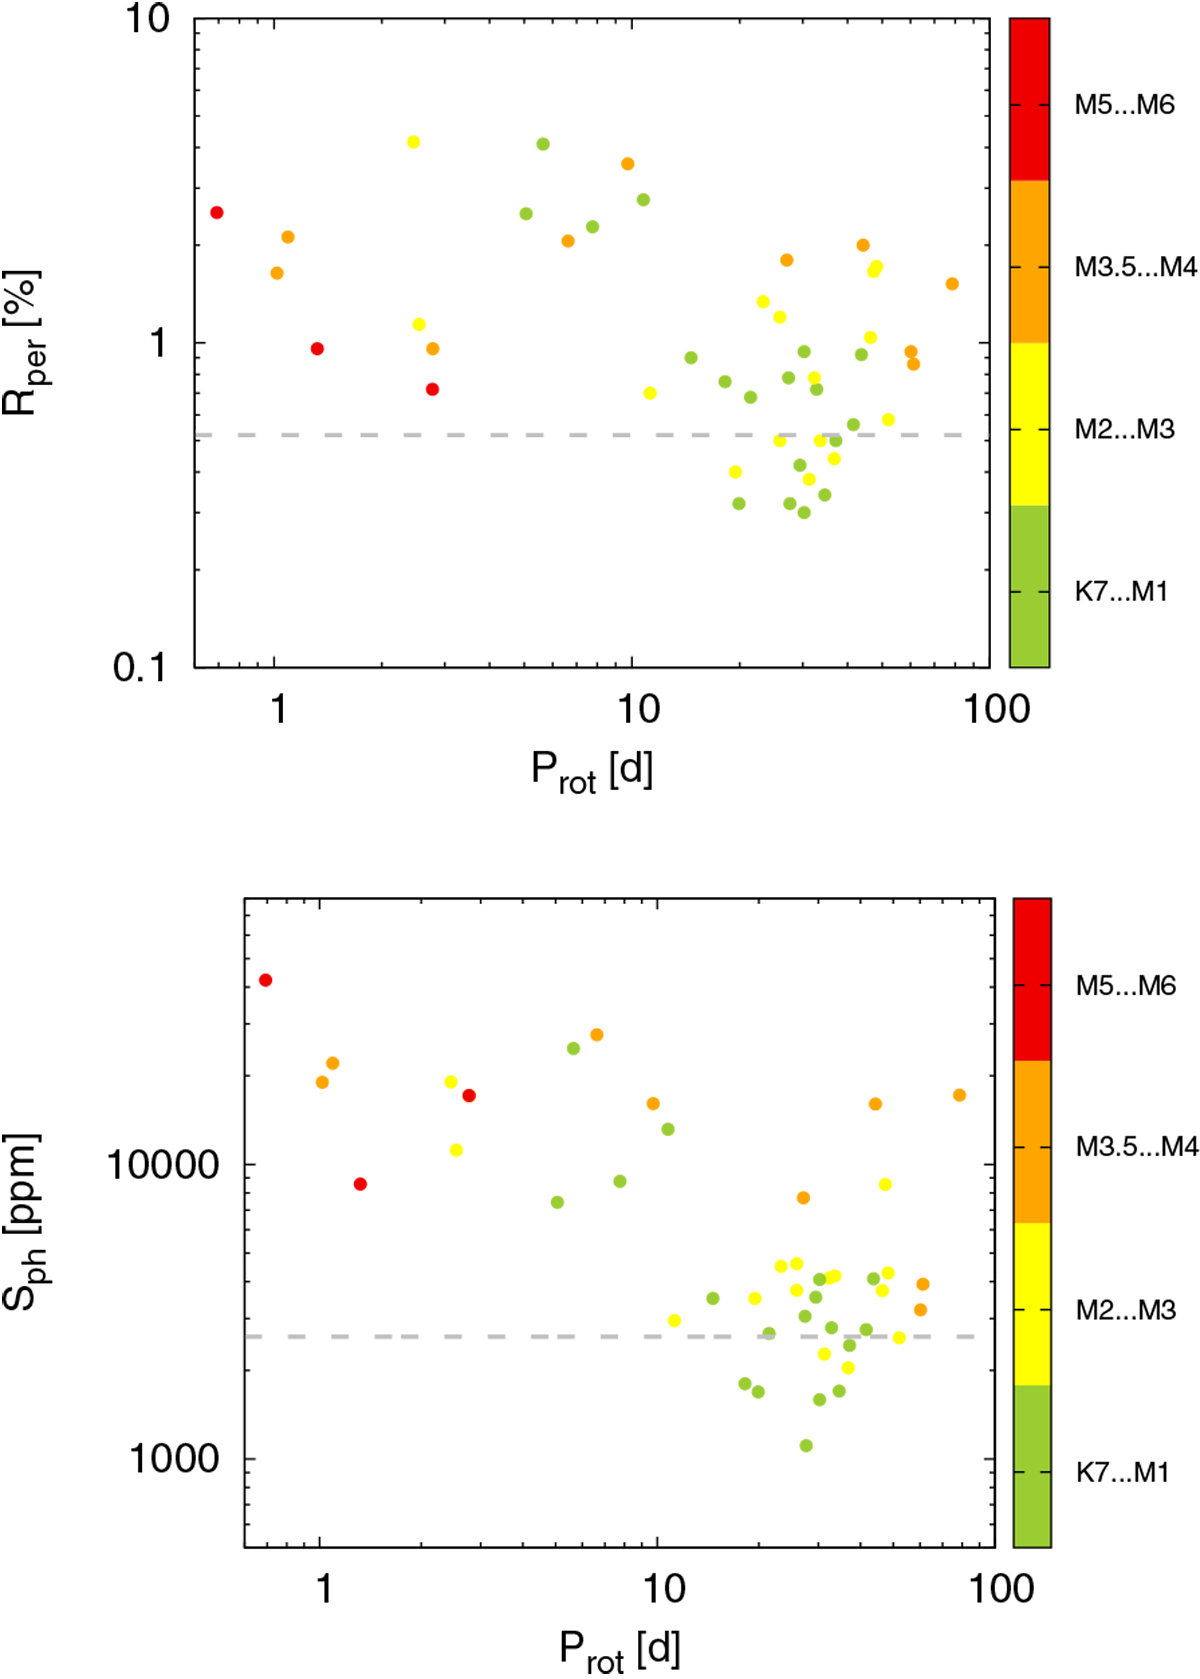
Full amplitude of the rotation signal given in percent (Rper, top) and the standard deviation of the full LC (Sph, bottom) vs. the rotation period for the short-cadence K2 LCs of our sample targets. The dashed gray line corresponds to the average Sflat of the fast-rotating M dwarfs. All values above this line were considered for our statistical analysis to be unaffected by a detection bias (see text).
Current usage metrics show cumulative count of Article Views (full-text article views including HTML views, PDF and ePub downloads, according to the available data) and Abstracts Views on Vision4Press platform.
Data correspond to usage on the plateform after 2015. The current usage metrics is available 48-96 hours after online publication and is updated daily on week days.
Initial download of the metrics may take a while.