Fig. B.1.
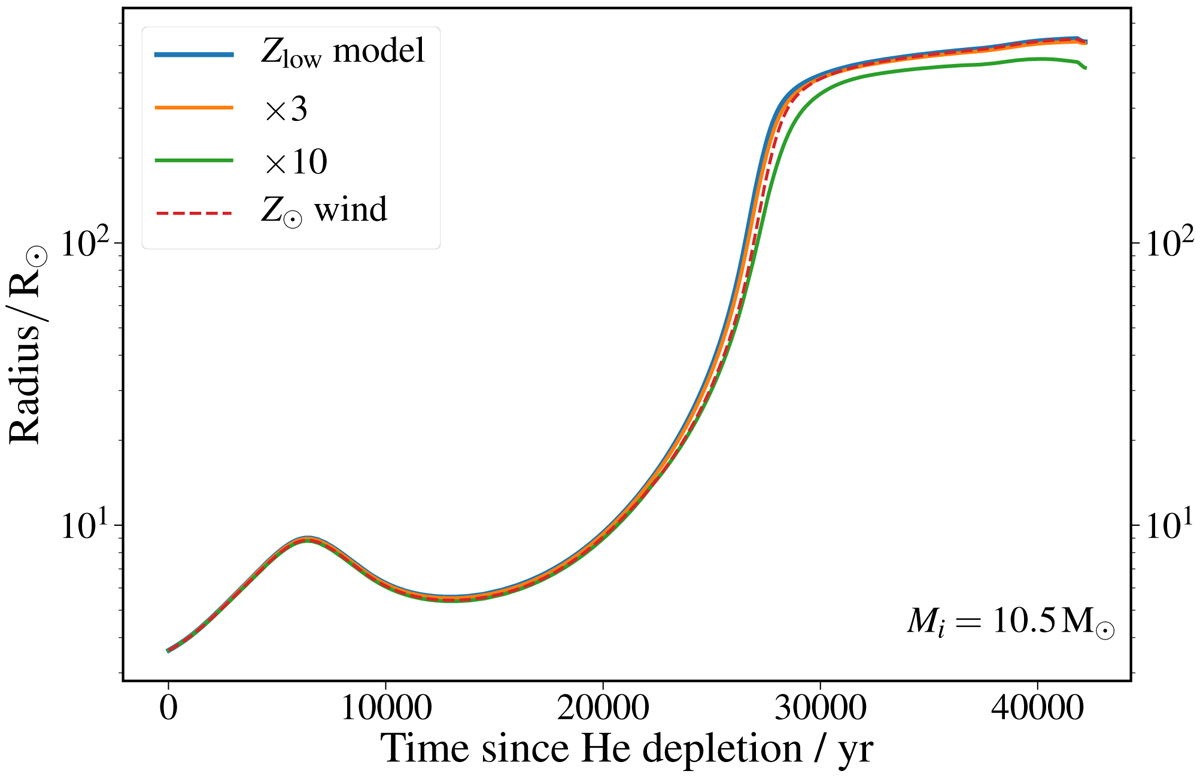
Radius evolution of low-metallicity stripped-star models with an initial mass of 10.5 M⊙ as a function of time after core helium depletion. The blue curve represents a model computed with our default wind scheme, while the orange and green curves are for models with mass-loss rates 3 and 10 times higher than the default, respectively. The dashed red curve represents a low-metallicity model computed with the solar metallicity mass-loss scheme.
Current usage metrics show cumulative count of Article Views (full-text article views including HTML views, PDF and ePub downloads, according to the available data) and Abstracts Views on Vision4Press platform.
Data correspond to usage on the plateform after 2015. The current usage metrics is available 48-96 hours after online publication and is updated daily on week days.
Initial download of the metrics may take a while.