Fig. 4.
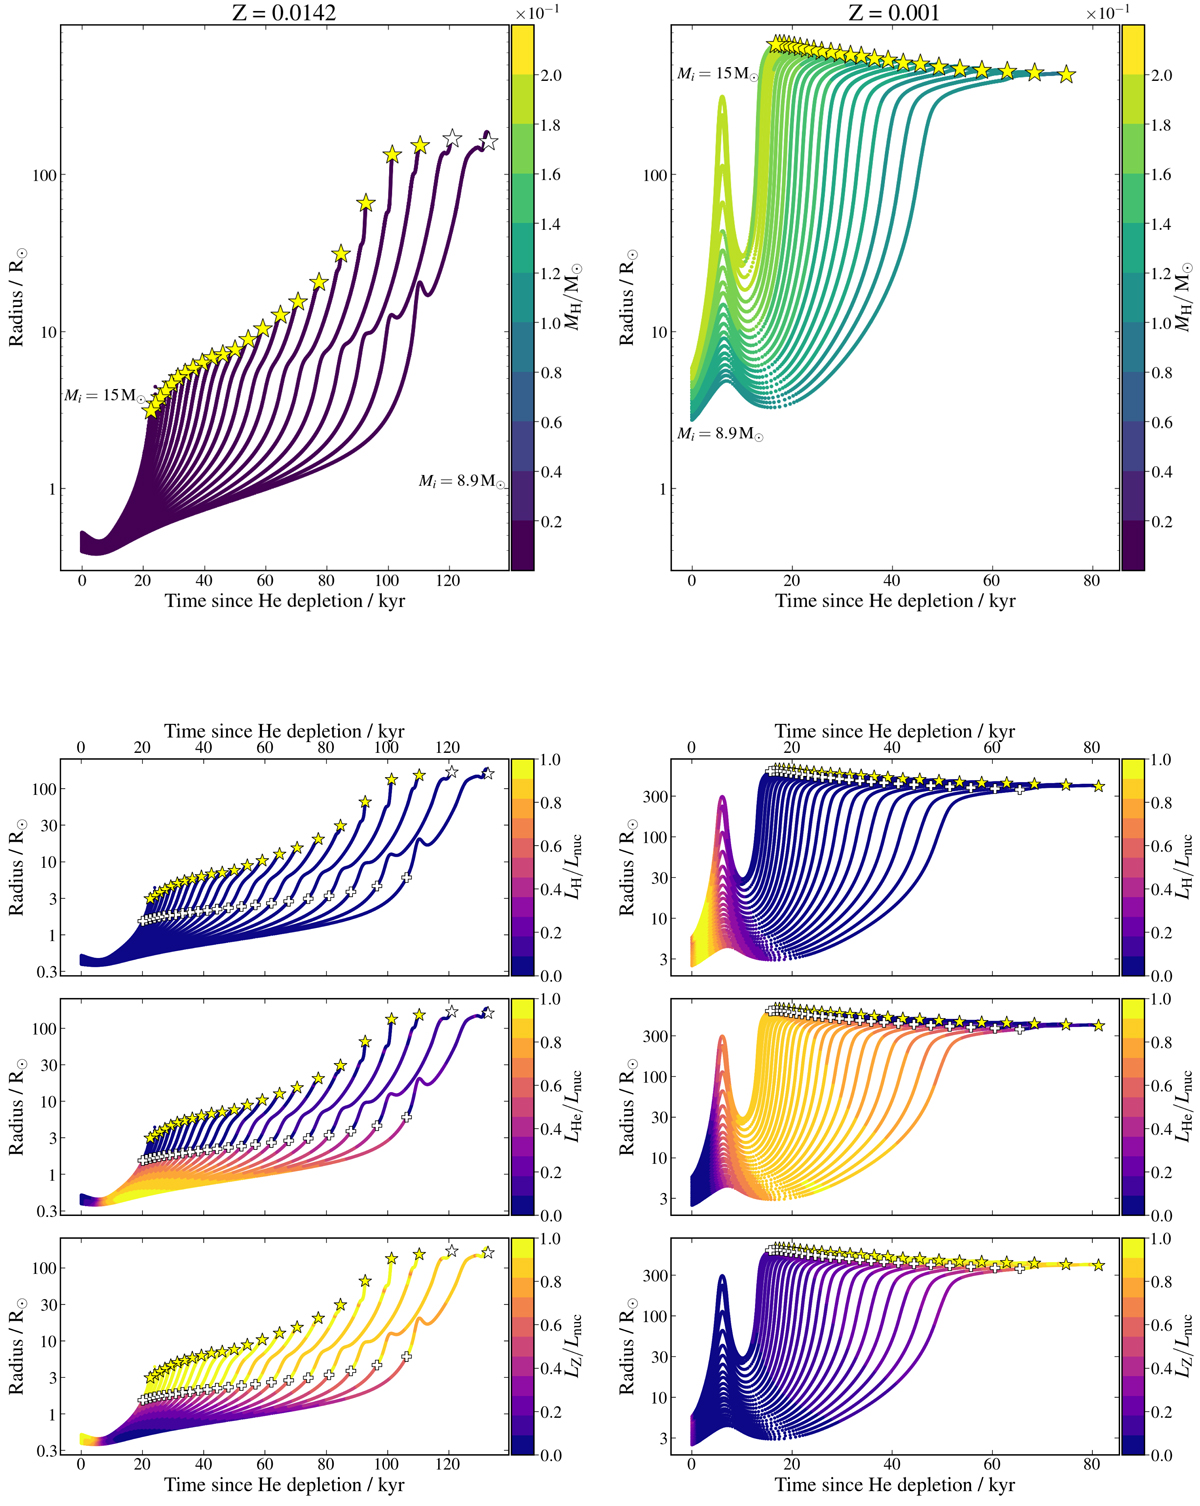
Evolution of the radius as a function of time after core helium depletion for the stars in our model grids at solar (left) and lower (right) metallicity. From top to bottom, colors indicate the remaining mass of hydrogen and the normalized luminosity from nuclear burning of hydrogen, helium, and heavier elements; see text for details. More massive stars evolve faster and are thus located towards the left of the figures. White crosses indicate the moment of core carbon ignition. Yellow star symbols indicate core carbon exhaustion, and white star symbols denote the final time step calculated for models that did not reach core carbon exhaustion.
Current usage metrics show cumulative count of Article Views (full-text article views including HTML views, PDF and ePub downloads, according to the available data) and Abstracts Views on Vision4Press platform.
Data correspond to usage on the plateform after 2015. The current usage metrics is available 48-96 hours after online publication and is updated daily on week days.
Initial download of the metrics may take a while.