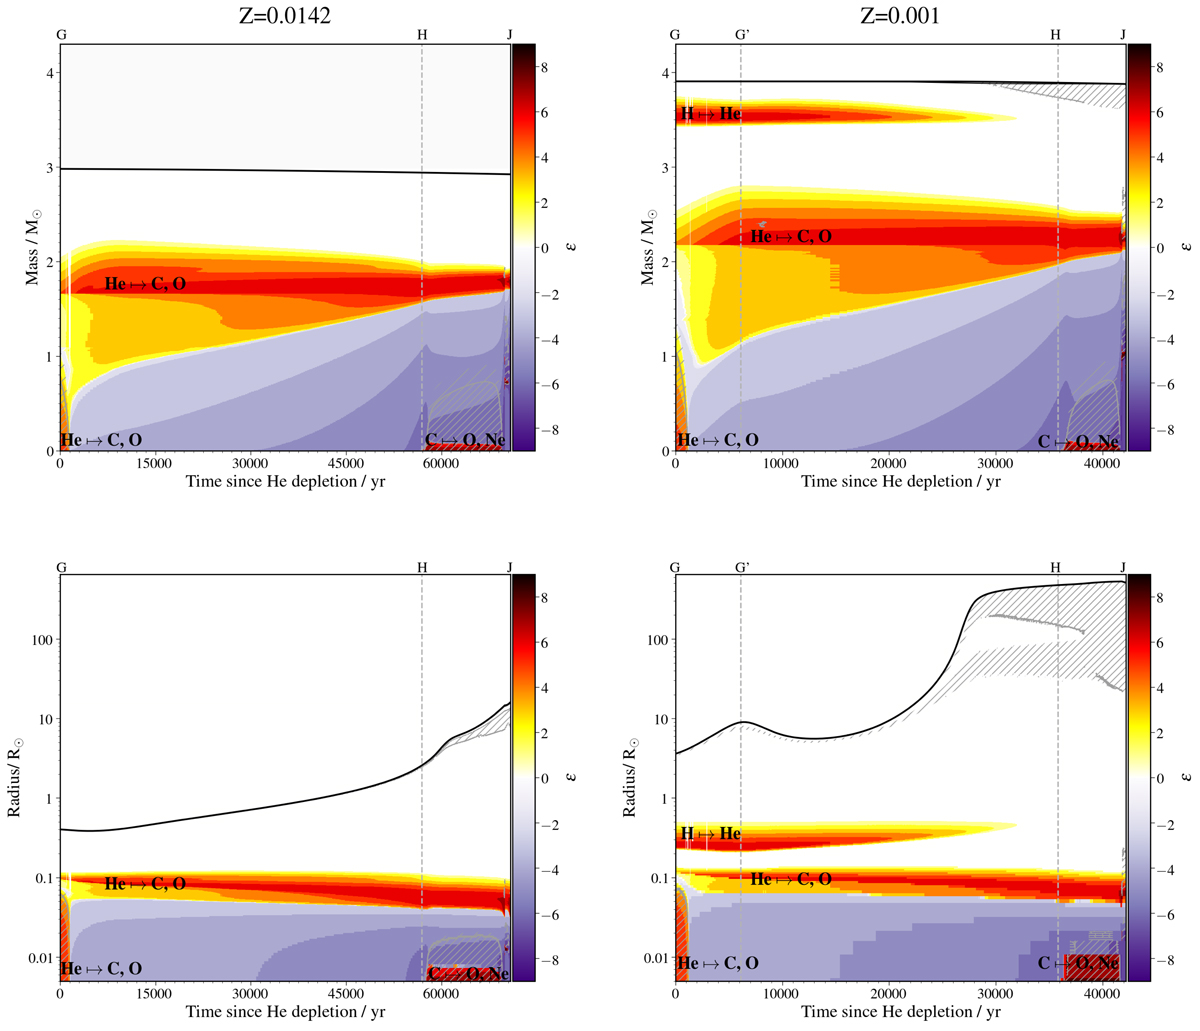
Fig. 2.

Kippenhahn diagrams showing the evolution of the stellar structure for our two example models at solar (left panels) and low (right panels) metallicity. They are shown using mass coordinate as the vertical axis (top panels) and radius coordinate (bottom panels). The horizontal axis indicates the time since helium depletion up to core carbon depletion. The black line represents the surface of the star. Regions of mixing by convection and overshooting are marked with double- and single-hatches, respectively. Colors indicate zones dominated by nuclear burning or neutrino cooling. See Fig. 1 and Sect. 3 for details and a discussion.
Current usage metrics show cumulative count of Article Views (full-text article views including HTML views, PDF and ePub downloads, according to the available data) and Abstracts Views on Vision4Press platform.
Data correspond to usage on the plateform after 2015. The current usage metrics is available 48-96 hours after online publication and is updated daily on week days.
Initial download of the metrics may take a while.


