Fig. 1.
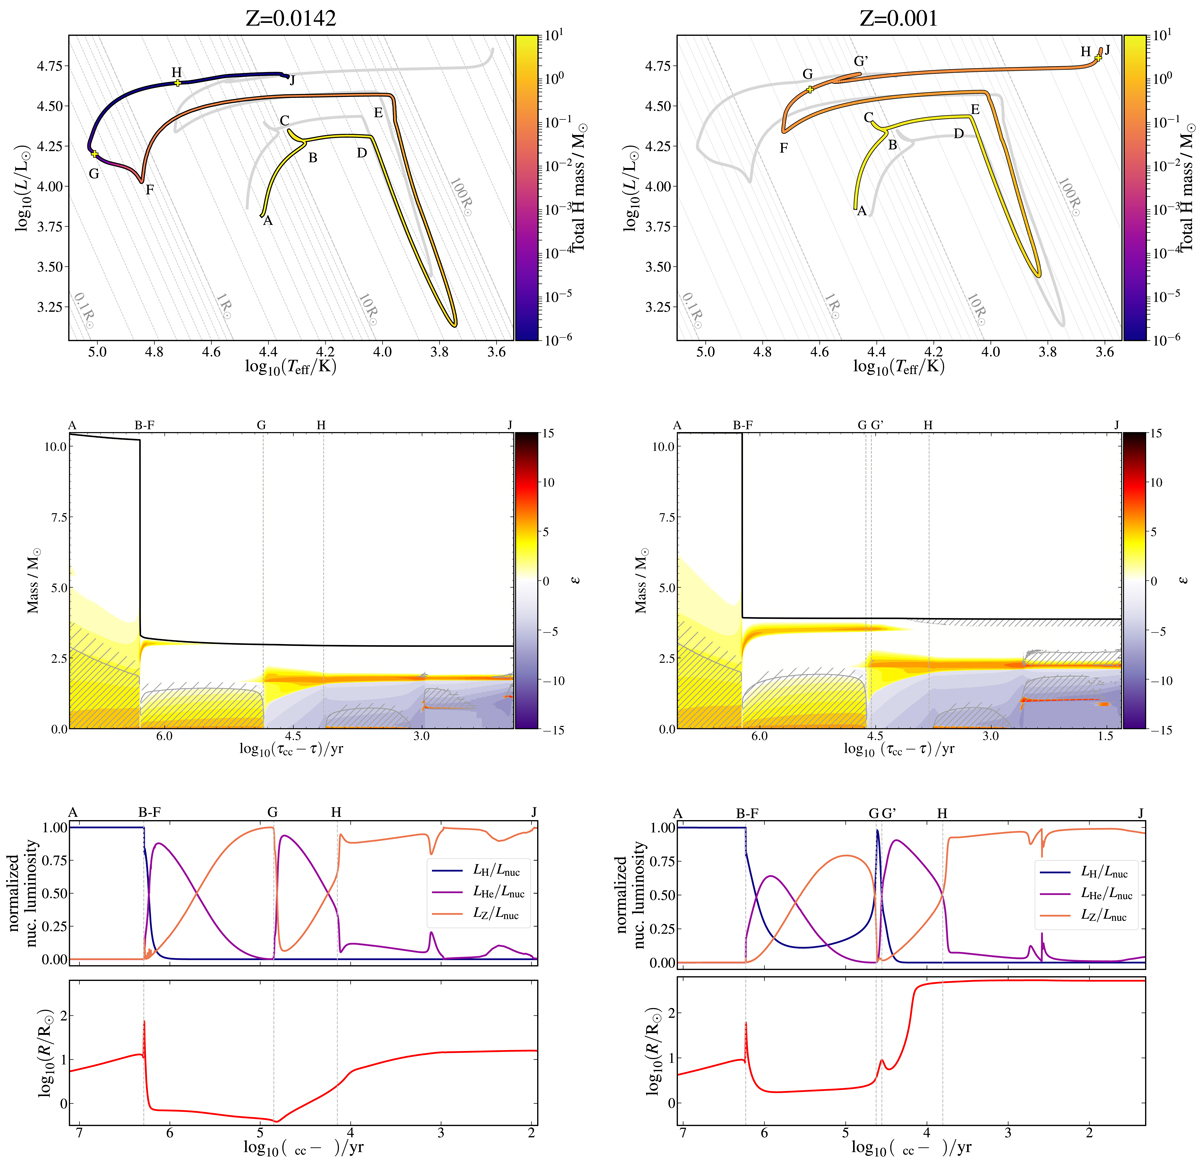
Evolution of a high (left) and low (right) metallicity star of initially 10.5 M⊙ that is stripped due to binary interaction. Letters A to J mark evolutionary points discussed in Sect. 3. Top: evolutionary tracks on the Hertzsprung-Russell diagram. The color indicates the total mass of hydrogen present at a given moment. For comparison, we show lines of constant radii as well as the evolution of the alternate-metallicity model in gray. Middle: evolution of the stellar structure of the stars in mass coordinate (Kippenhahn diagrams), given as a function of time until core collapse (τcc). Convective and overshooting regions are marked with double- and single-hatched regions, respectively. Colors indicate zones dominated by nuclear burning (yellow) or neutrino cooling (purple) where ϵ = sign(ϵnuc−ϵν)log10(max(1.0,|ϵnuc−ϵν|)/[erg g−1 s−1]). Here ϵnuc is the nuclear energy generation rate and ϵν the neutrino energy. The black line indicates the location of the stellar surface. Bottom: luminosity produced by hydrogen-, helium- and metal-burning as a fraction of the total luminosity produced by nuclear reactions (upper) and stellar radius (lower) as a function of time until core-collapse.
Current usage metrics show cumulative count of Article Views (full-text article views including HTML views, PDF and ePub downloads, according to the available data) and Abstracts Views on Vision4Press platform.
Data correspond to usage on the plateform after 2015. The current usage metrics is available 48-96 hours after online publication and is updated daily on week days.
Initial download of the metrics may take a while.